A study was done on proctored and nonproctored tests. The results are shown in the table. Assume that the two samples are independent simple random samples selected from normally distributed populations, and do not assume that the population standard deviations are equal. Complete parts (a) and (b) below. a. Use a 0.05 significance level to test the claim that students taking nonproctored tests get a higher mean score than those taking proctored tests. What are the null and alternative hypotheses? OA Ho: ₁42 H₂H₁ H₂ C. Ho: H1 H2 На жена The test statistic, t, is 99. (Round to two decimal places as needed.) The P-value is 163 (Round to three decimal places as needed.) State the conclusion for the test. OB. Ho: H1 H₂ H₁: Hy > H₂ OD. Ho: H1 H2 H₁: H₁ H₂ OA. Reject Ho. There is not sufficient evidence to support the claim that students taking nonproctored tests get a higher mean score than those taking proctored tests. B. Fail to reject Ho. There is not sufficient evidence to support the claim that students taking nonproctored tests get a higher mean score than those taking proctored tests. OC. Fail to reject Ho. There is sufficient evidence to support the claim that students taking nonproctored tests get a higher mean score than those taking proctored tests. OD. Reject Ho. There is sufficient evidence to support the claim that students taking nonproctored tests get a higher mean score than those taking proctored tests. b. Construct a confidence interval suitable for testing the claim that students taking nonproctored tests get a higher mean score than those taking proctored tests. -11.87 <₁-₂3.07 (Round to two decimal places as needed.) Proctored Nonproctored H₁ #2 n 35 30 82.25 x 77.85 $10.06 22.41 H
A study was done on proctored and nonproctored tests. The results are shown in the table. Assume that the two samples are independent simple random samples selected from normally distributed populations, and do not assume that the population standard deviations are equal. Complete parts (a) and (b) below. a. Use a 0.05 significance level to test the claim that students taking nonproctored tests get a higher mean score than those taking proctored tests. What are the null and alternative hypotheses? OA Ho: ₁42 H₂H₁ H₂ C. Ho: H1 H2 На жена The test statistic, t, is 99. (Round to two decimal places as needed.) The P-value is 163 (Round to three decimal places as needed.) State the conclusion for the test. OB. Ho: H1 H₂ H₁: Hy > H₂ OD. Ho: H1 H2 H₁: H₁ H₂ OA. Reject Ho. There is not sufficient evidence to support the claim that students taking nonproctored tests get a higher mean score than those taking proctored tests. B. Fail to reject Ho. There is not sufficient evidence to support the claim that students taking nonproctored tests get a higher mean score than those taking proctored tests. OC. Fail to reject Ho. There is sufficient evidence to support the claim that students taking nonproctored tests get a higher mean score than those taking proctored tests. OD. Reject Ho. There is sufficient evidence to support the claim that students taking nonproctored tests get a higher mean score than those taking proctored tests. b. Construct a confidence interval suitable for testing the claim that students taking nonproctored tests get a higher mean score than those taking proctored tests. -11.87 <₁-₂3.07 (Round to two decimal places as needed.) Proctored Nonproctored H₁ #2 n 35 30 82.25 x 77.85 $10.06 22.41 H

Glencoe Algebra 1, Student Edition, 9780079039897, 0079039898, 2018
18th Edition
ISBN:9780079039897
Author:Carter
Publisher:Carter
Chapter10: Statistics
Section10.4: Distributions Of Data
Problem 19PFA

Related questions
Question
Solve for B ...if you can show me how to solve this on a ti84 plus
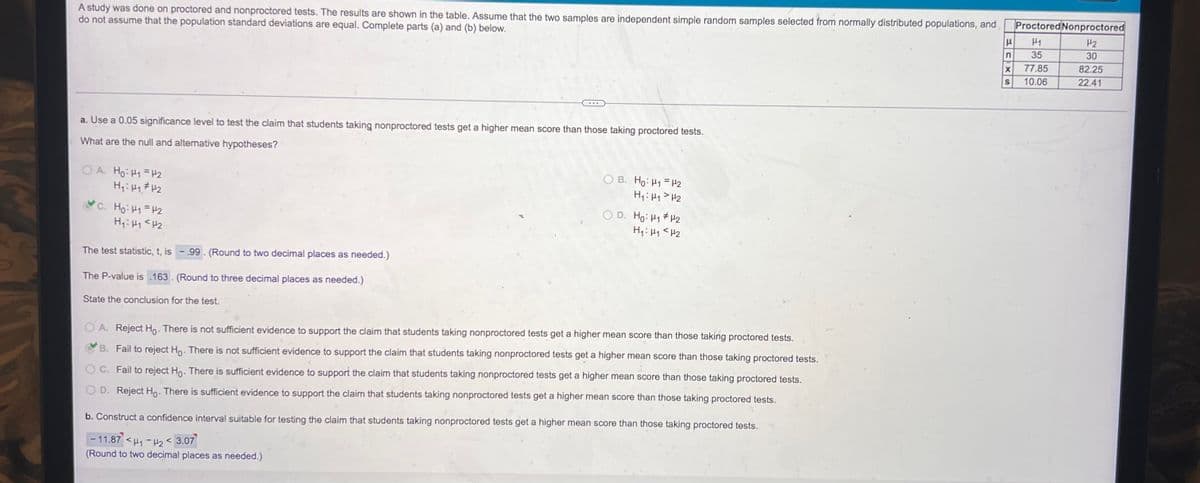
Transcribed Image Text:A study was done on proctored and nonproctored tests. The results are shown in the table. Assume that the two samples are independent simple random samples selected from normally distributed populations, and
do not assume that the population standard deviations are equal. Complete parts (a) and (b) below.
a. Use a 0.05 significance level to test the claim that students taking nonproctored tests get a higher mean score than those taking proctored tests.
What are the null and alternative hypotheses?
OA. Ho: H1 H2
H₁: H₁ H₂
C. Ho: H₁ =H2
H₁: H₁ <H₂
...
The test statistic, t, is -. 99. (Round to two decimal places as needed.)
The P-value is 163. (Round to three decimal places as needed.)
State the conclusion for the test.
OB. Ho: H1 H2
H₁: H₁ H₂
O D. Ho: H₁ H2
H₁: H₁ H₂
A. Reject Ho. There is not sufficient evidence to support the claim that students taking nonproctored tests get a higher mean score than those taking proctored tests.
B. Fail to reject Ho. There is not sufficient evidence to support the claim that students taking nonproctored tests get a higher mean score than those taking proctored tests.
C. Fail to reject Ho. There is sufficient evidence to support the claim that students taking nonproctored tests get a higher mean score than those taking proctored tests.
D. Reject Ho. There is sufficient evidence to support the claim that students taking nonproctored tests get a higher mean score than those taking proctored tests.
b. Construct a confidence interval suitable for testing the claim that students taking nonproctored tests get a higher mean score than those taking proctored tests.
-11.87 <₁-₂3.07
(Round to two decimal places as needed.)
Proctored Nonproctored
H
H₂
H1
n 35
30
82.25
22.41
X
77.85
S 10.06
Expert Solution
This question has been solved!
Explore an expertly crafted, step-by-step solution for a thorough understanding of key concepts.

This is a popular solution!

Trending now
This is a popular solution!

Step by step
Solved in 3 steps with 1 images

Recommended textbooks for you
Glencoe Algebra 1, Student Edition, 9780079039897…
Algebra
ISBN:
9780079039897
Author:
Carter
Publisher:
McGraw Hill
Glencoe Algebra 1, Student Edition, 9780079039897…
Algebra
ISBN:
9780079039897
Author:
Carter
Publisher:
McGraw Hill