A random sample of 154 recent donations at a certain blood bank reveals that 87 were type A blood. Does this suggest that the actual percentage of type A donations differs from 40%, the percentage of the population having type A blood? Carry out a test of the appropriate hypotheses using a significance level of 0.01. LAUSE SALT State the appropriate null and alternative hypotheses. OH₂D-0.40 M₂: P > 0.40 OM₂: P = 0.40 M: P-0.40 OM: P-0.40 H₂: P < 0.40 ⒸH₂: P-0.40 H₂:D 0.40 Calculate the test statistic and determine the P-value. (Round your test statistic to two decimal places and your P-value to four decimal places.) P-value=
A random sample of 154 recent donations at a certain blood bank reveals that 87 were type A blood. Does this suggest that the actual percentage of type A donations differs from 40%, the percentage of the population having type A blood? Carry out a test of the appropriate hypotheses using a significance level of 0.01. LAUSE SALT State the appropriate null and alternative hypotheses. OH₂D-0.40 M₂: P > 0.40 OM₂: P = 0.40 M: P-0.40 OM: P-0.40 H₂: P < 0.40 ⒸH₂: P-0.40 H₂:D 0.40 Calculate the test statistic and determine the P-value. (Round your test statistic to two decimal places and your P-value to four decimal places.) P-value=

MATLAB: An Introduction with Applications
6th Edition
ISBN:9781119256830
Author:Amos Gilat
Publisher:Amos Gilat
Chapter1: Starting With Matlab
Section: Chapter Questions
Problem 1P

Related questions
Question
Q14. Please answer the fill-ins.
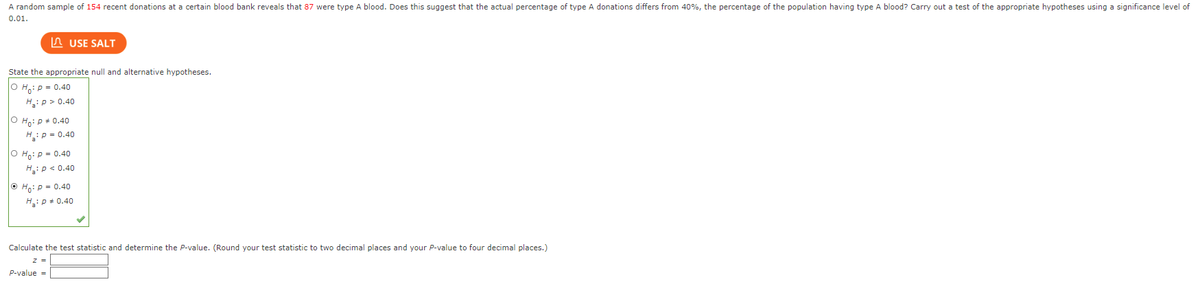
Transcribed Image Text:A random sample of 154 recent donations at a certain blood bank reveals that 87 were type A blood. Does this suggest that the actual percentage of type A donations differs from 40%, the percentage of the population having type A blood? Carry out a test of the appropriate hypotheses using a significance level of
0.01.
USE SALT
State the appropriate null and alternative hypotheses.
OH: P = 0.40
H₂: P > 0.40
O Ho: P = 0.40
H₂: P = 0.40
O Ho: P = 0.40
H₂: P < 0.40
ⒸHo: P = 0.40
H₂: P = 0.40
Calculate the test statistic and determine the P-value. (Round your test statistic to two decimal places and your P-value to four decimal places.)
Z =
P-value=
Expert Solution
This question has been solved!
Explore an expertly crafted, step-by-step solution for a thorough understanding of key concepts.

This is a popular solution!

Trending now
This is a popular solution!

Step by step
Solved in 2 steps with 2 images

Recommended textbooks for you
MATLAB: An Introduction with Applications
Statistics
ISBN:
9781119256830
Author:
Amos Gilat
Publisher:
John Wiley & Sons Inc

Probability and Statistics for Engineering and th…
Statistics
ISBN:
9781305251809
Author:
Jay L. Devore
Publisher:
Cengage Learning

Statistics for The Behavioral Sciences (MindTap C…
Statistics
ISBN:
9781305504912
Author:
Frederick J Gravetter, Larry B. Wallnau
Publisher:
Cengage Learning
MATLAB: An Introduction with Applications
Statistics
ISBN:
9781119256830
Author:
Amos Gilat
Publisher:
John Wiley & Sons Inc
Probability and Statistics for Engineering and th…
Statistics
ISBN:
9781305251809
Author:
Jay L. Devore
Publisher:
Cengage Learning
Statistics for The Behavioral Sciences (MindTap C…
Statistics
ISBN:
9781305504912
Author:
Frederick J Gravetter, Larry B. Wallnau
Publisher:
Cengage Learning

Elementary Statistics: Picturing the World (7th E…
Statistics
ISBN:
9780134683416
Author:
Ron Larson, Betsy Farber
Publisher:
PEARSON

The Basic Practice of Statistics
Statistics
ISBN:
9781319042578
Author:
David S. Moore, William I. Notz, Michael A. Fligner
Publisher:
W. H. Freeman

Introduction to the Practice of Statistics
Statistics
ISBN:
9781319013387
Author:
David S. Moore, George P. McCabe, Bruce A. Craig
Publisher:
W. H. Freeman