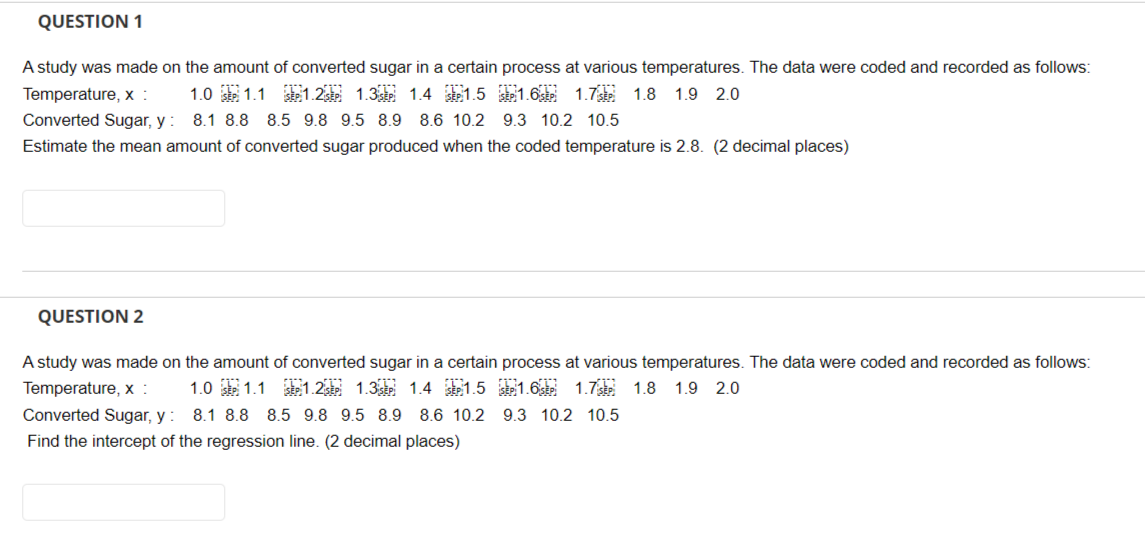
A study was made on the amount of converted sugar in a certain process at various temperatures. The data were coded and recorded as follows: Temperature, x : 1.0 1.1 1.2 1.3 1.4 1.5 1.6 1.7 1.8 1.9 2.0 Converted Sugar, y: 8.1 8.8 8.5 9.8 9.5 8.9 8.6 10.2 9.3 10.2 10.5 Estimate the mean amount of converted sugar produced when the coded temperature is 2.8. (2 decimal places)
Q: μ=40.5μ=40.5 grams σ=3.1σ=3.1 grams If one such bearing is removed from the production line and…
A: Given that The steel ball bearings production is normally distributed with Mean (μ) = 40.5 grams…
Q: 9. The table below revealed the result of the pre-test in mathematics given to 50 students. Scores…
A: From the frequency table aboven=50D7 class:Class with (7n10)th value of the observation in cf…
Q: 2.10 x and s by Hand. Radon is a naturally occurring gas and is the second leading cause of lung…
A: 2.10) The number of observations is 4.
Q: A social worker reports that 30% of workers in a factory are below 15 years of age. Of the 120…
A:
Q: The records of a light bulb manufacturer show that, when the manufacturing machinery is working…
A: Given that the records of a light bulb manufacturer show that, when the manufacturing machinery is…
Q: STATISTICS AND PROBABILITY Multiple Choice! No long explaantion needed. THUMBS-UP will be given!…
A:
Q: 1) Consider the experiment consists of two independent rolls of a 4-sided f random variable which is…
A: As per our guidelines, we have provided answer for first 3 sub-parts only. Please repost other…
Q: IfX~N(7,4), the P(15.364 ≤ (X-7)² ≤ 20.095) is
A: Given problem is :
Q: You play a game of chance in which you can either win or lose (there are no other possibilities).…
A: Considering the success in the game (i.e., winning the game) is obtained in a Bernoulli trial (i.e.,…
Q: The following data points represent the number of points scored by each player on the Nemco…
A:
Q: Suppose that buses arrive are scheduled to arrive at a bus stop at noon but are always X minutes…
A:
Q: P = 0.15 P≤ 0.3 p≥ 0.6 P = 0.15 p> 0.3 p < 0.6 0.13 80 Confidence level = 95% 0.31 65 0.55 40 0.05…
A: 5) Given: H0:p=0.15Ha:p≠0.15 p^=0.13 n=80 Confidence level = 95%
Q: Determine whether the results appear to have statistical significance, and also determine whether…
A: Given dataIn a study of a birth sex selection method2040 users of the method gave birth to 997 males…
Q: a) What does the u in the equation represent?__ b) What does the o in the equation represent? c)…
A: f(x)=1σ2π*e-12x-μσ2 a) what does the μ in the equation represent mean
Q: C. confidence interval D. all of these 36. Which of the following are the 95% confidence…
A: It is given that the 95% confidence interval. Here, need to find out the 95% confidence coefficient.…
Q: a) Find the probability that the winner won gold, given that the winner was from the U.S. P (gold I…
A: From the contingency tableP(A|B)=P(A∩B)P(B)thena.P(Gold ∩ U.S.)=36957P(U.S.)=110957Then P(Gold…
Q: A study was conducted to measure the weights of cabbage produced by a farm in Benguet. The weights…
A:
Q: Determine if the number of body fats percentage of men is lesser than the body fats percentage of…
A: For Men (x1): sample size (n1) = 6 sample mean (x̄1) = Σx1 /n1 =96.07/6 = 16.01 sample standard…
Q: Not vulnerable Vulnerable Score if you make Score if you make 3 spades 4 spades 2 spades 3 spades 4…
A: Given as,
Q: It is well known that a placebo, a fake medication or treatment, can sometimes have a positive…
A: The provided information is…
Q: Z/t Computed Value Z/t Critical Value 1. Zcomputed = 1.02 1. Zcritical = 1.64 2. Zcomputed = 2.15 3.…
A: The objective is to determine the decision for each of the following given the computed and critical…
Q: HYPOTHESIS TESTING 1.) One of the undersecretaries of the Department of Labor and Employment (DOLE)…
A: The following information has been given: The sample mean is x¯=17350. The sample standard deviation…
Q: Which of the following is true about the variance? Extreme values may skew the given data set The…
A: The variance of a data shows how far each data points varies from their mean. Variance is best…
Q: Sampling distribution Suppose population 1 is all blue cars sold at used car auctions, and the mean…
A: Given A multiple choice question on sampling distribution.we need to determine whether the sample…
Q: ohn's answering machine receives about 28 telephone calls between 8:00 am and 8:00 pm. Let X = the…
A:
Q: Suppose that a Markov chain has the following transition matrix The recurrent states are A₁ A₂ A3 A4…
A: Given a markov chain with transition matrix. We have to find the recurrent states.
Q: Answer the following 1. Computer for each of the following • + c Σχι 225. Στα 225. Σεΐ 953. Σε ο…
A: a.The provided information is Σx=225Σy=22.5Σx2=9653Σy2=143Σxy=651n=6The correlation coefficient is…
Q: Suppose the time (minutes) an Instructor spends grading a Math 10 quiz is uniformly distributed in…
A: Let X denote the time, an instructor spends grading a math 10 quiz. Then, X ~ Uniform(8,25) => a…
Q: 1. Zcomputed 2. Zcomputed 3. Z computed Z/t Computed Value = 1.11, confidence level=90%, one-tailed…
A:
Q: A medical researcher is studying the relationship between pica and iron deficiency. She measures the…
A: Given Information: Mean μ=13.2 Standard deviation σ=1.2
Q: Salaries at a large corporation are normally distributed with a mean of $45,000 and a standard…
A: The normal distribution shows the probability value using the standard score or raw score. It is…
Q: We asked a random sample 100 economists whether inflation is likely to rise in the coming year. 62…
A: Given that: Sample size, n = 100 Number of successes, x = 62 Significance level, α=0.10
Q: B. Complete the table. Ho: P = 0.3 P = 0.7 p = 0.78 P = 0.28 P = 0.15 P≤ 0.3 P≥ 0.6 Ha: P = 0.3 P =…
A:
Q: The average IQ in a population is 100 with standard deviation 15 (by definition, IQ is normalized so…
A: The question is about central limit theorem Given : Popl. mean IQ of people ( μ ) = 100 Popl. std.…
Q: 2 8 3 5 4…
A: Given A tae containing the no of days the backpacking trip was.we need to find whether the…
Q: case that the pete for four seasons in each sport. Due to the maturing of bodies and skill set, and…
A: It is given that the population of difference in the number of sets played in the fourth and first…
Q: Question 3 P(-2.25 <z< 0.2) ▼ For a standard normal distribution, find: Question Help: Morr < (round…
A:
Q: Suppose a pharmaceutical company developed a new drug, designed to prevent the flu. The company…
A: Given: The company states that the drug is more effective for women than for men. To test this…
Q: 20. If Eunice has a percentile rank of 40, what is her height given the table below? Height in cm f…
A: From the provided frequency table The lower boudary is L=165The percentile rank is R=40The Total…
Q: A psychologist is interested investigating the proportion of depressed teenagers in a particular…
A: Given that A psychologist is interested investigating the proportion of depressed teenagers in a…
Q: For a normally distributed random varible y, mean is 25 and standard deviation is 9. Find the z…
A:
Q: Determine whether there is a significant difference on the perceived capabilities in research when…
A: Note: As per answering guidelines I have to answer only one question in case of multiple different…
Q: Let X be a random variable for CoViD-19 infection (Positive, Negative). Consider two attributes Sex…
A: Given that: Sex Positive Negative Male 1 12 Female 13 4 Age Positive Negative below…
Q: 7 What is the spread of the sampling distribution of X1-X₂?
A:
Q: While in college student athletes can compete for four seasons in each sport. Due to the maturing of…
A: The following information has been given: x¯1=72.00 x¯2=47.50s1=17.24…
Q: Given a random variable Z with a standard normal distribution, calculate the following…
A:
Q: Sampling distribution Suppose population 1 is all blue cars sold at used car auctions, and the mean…
A: Answer: Yes
Q: 1) A series of experiments were conducted to determine the effect of air voids on percentage…
A: Null hypothesis: H0:µ1 = µ2 = µ3 Alternative hypothesis: H1: At least one of the means is different…
Q: ABILITY Multiple Choice! No long explaantion needed. THUMBS-UP will be given! A Philippine labor…
A: To find the labor group claim that the mean income of managers in the retail industry is still at…
Q: matter? [Q2] The probability distribution for the discrete random variable in the table below. Find:…
A:
pls box the answers
Step by step
Solved in 2 steps with 1 images
- Urban Travel Times Population of cities and driving times are related, as shown in the accompanying table, which shows the 1960 population N, in thousands, for several cities, together with the average time T, in minutes, sent by residents driving to work. City Population N Driving time T Los Angeles 6489 16.8 Pittsburgh 1804 12.6 Washington 1808 14.3 Hutchinson 38 6.1 Nashville 347 10.8 Tallahassee 48 7.3 An analysis of these data, along with data from 17 other cities in the United States and Canada, led to a power model of average driving time as a function of population. a Construct a power model of driving time in minutes as a function of population measured in thousands b Is average driving time in Pittsburgh more or less than would be expected from its population? c If you wish to move to a smaller city to reduce your average driving time to work by 25, how much smaller should the city be?question 13 Annual high temperatures in a certain location have been tracked for several years. Let XX represent the year and YY the high temperature. Based on the data shown below, calculate the correlation coefficient (to three decimal places) between XX and YY. Use your calculator! x y 4 47.6 5 48.18 6 43.36 7 41.34 8 41.32 9 38 10 38.68 11 33.86 12 31.84 13 32.92 14 29.8 15 29.18 16 25.46 17 24.64 18 22.12 19 18.3 r=Question 4: The following data includes the year, make, model, mileage (in thousands of miles) and asking price (in US dollars) for each of 13 used Honda Odyssey minivans. The data was collected from the Web site of the Seattle P-I on April 25, 2005. year make model mileage price 2004 Honda Odyssey EXL 20 26900 2004 Honda Odyssey EX 21 23000 2002 Honda Odyssey 33 17500 2002 Honda Odyssey 41 18999 2001 Honda Odyssey EX 43 17200 2001 Honda Odyssey EX 67 18995 2000 Honda Odyssey LX 46 13900 2000 Honda Odyssey EX 72 15250 2000 Honda Odyssey EX 82 13200 2000 Honda Odyssey 99 11000 1999 Honda Odyssey 71 13900 1998 Honda Odyssey 85 8350 1995 Honda Odyssey EX 100 5800 Compute the correlation between age (in years) and mileage for these minivans. (Assume the correlation conditions have been satisfied and round your answer to the nearest 0.001.)
- QUESTION 4 Determine whether the given percentage is a statistic or a parameter and why. In a study of all 1018 students at Guttman, data showed that 10% live in Queens. a. Parameter because the value is a numerical measurement describing a characteristic of a sample. b. Statistic because the value is a numerical measurement describing a characteristic of a sample. c. Parameter because the value is a numerical measurement describing a characteristic of a population. d. Statistic because the value is a numerical measurement describing a characteristic of a population.QUESTION 4 (a) The researcher is concerned that older persons may not be knowledgeable of the COFLU-20. As such, he is interested in investigating the association between the age of the respondents and their knowledge level. Table 2 below shows the knowledge level of respondents, by age group. Table 2 Age Group Knowledge Level Total Poor Satisfactory Good 18 - 25 33 16 13 62 26 - 34 30 18 12 60 35 - 44 29 14 12 55 45 - 54 36 16 18 70 55 - 75 17 14 22 53 Total 145 78 77 300 (b) Finally, the researcher is interested in examining the regression model for knowledge, attitude and practices towards the COFLU-20. The following model was developed to forecast individual practices towards COFLU-20 using knowledge and attitude scores. P = α + β K + δ A where P = Practice towards COFLU-20 score K = Knowledge towards COFLU-20 score A = Attitude towards COFLU-20 score The data are processed using…Question 16: Run a regression analysis on the following bivariate set of data with y as the response variable. x y 48.6 77.8 85.7 25.8 33.9 -37.3 65.2 32.5 95.7 68.7 74.7 100.1 46.5 -34.3 43.8 -12.1 39 -64.1 77.7 36.8 69.1 43.6 Verify that the correlation is significant at an α=0.05α=0.05. If the correlation is indeed significant, predict what value (on average) for the explanatory variable will give you a value of -21.9 on the response variable.What is the predicted explanatory value?x = (Report answer accurate to one decimal place.)