Determine whether there is a significant difference on the perceived capabilities in research when grouped according to religious affiliation. Religious Perceived Capabilities Affiliation Christian 4.2 4.2 1.5 Buddhism 3.5 5.0 4.8 Hinduism 1.6 3.2 3.9
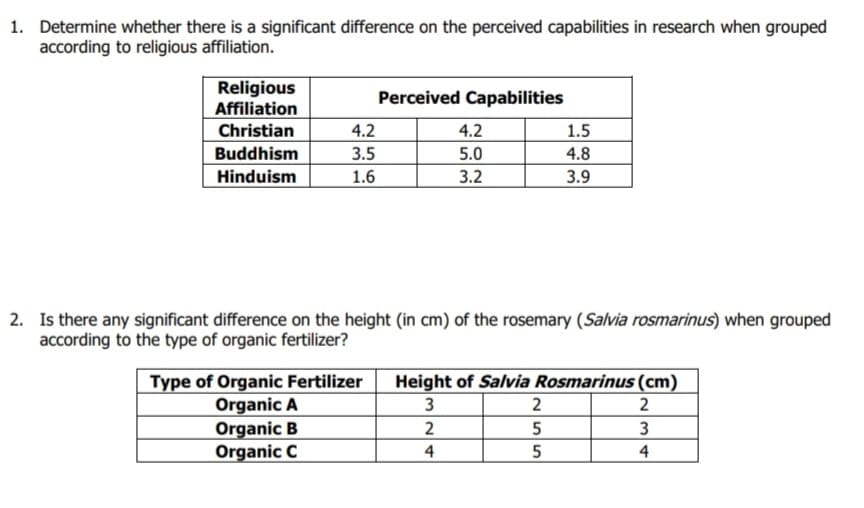
Q: Based on the model, a one unit increase in uniformity in cell size the odds of observing a malignant…
A:
Q: Suppose a random variable, x, follows a Poisson distribution. Let µ=2.5 every minute, find the…
A:
Q: A large university is curious if they should build another cafeteria. They plan to survey a sample…
A: The question is about type II error Given : Null and alt. hypo : H0 : p ≤ 0.4Ha : p > 0.4
Q: What type of pattern exists in the data? O The time series plot shows a horizontal pattern, but…
A: Time Series plot: Excel Procedure: Enter the values in Excel. Select the data Go to insert. Go to…
Q: 1- Let n and r be positive integers such that r≤n. Then (a) P = nx P-1 (c) P = pn a O b O d n-1 (b)…
A:
Q: Sampling distribution Suppose population 1 is all blue cars sold at used car auctions, and the mean…
A: Answer: Yes
Q: Suppose population 1 consists of all students who picked up all the tests they completed prior…
A: Given, For sample 1 : sample size (n1) = 56 sample mean (x̄1) = 83 sample variance (s1) = 10.4 For…
Q: An apple juice producer buys all his apples from a conglomerate of apple growers in one northwest…
A:
Q: Use the frequency distribution to the right, which shows the number of voters (in millions)…
A: frequency distribution of the number of voters(in millions) according to age is:- Ages of voters…
Q: Suppose that buses arrive are scheduled to arrive at a bus stop at noon but are always X minutes…
A: Buses arrive are scheduled to arrive at a bus stop at noon but are always X minutes late, where X is…
Q: The probability that none of the three bulbs in a set of traffic lights will have to be replaced…
A:
Q: 1. 1. The value of E(XY) is
A: Given that μ1=5.4, σ1=1.5, μ2=5.10, σ2=2, ρ=0.70 Y=6
Q: The data below represent commute times (in minutes) and scores on a well-being survey x (Commute…
A: a. In this case, the explanatory variable is the commute time (x) and the response variable is the…
Q: Define p(x,y) by p(0,1)=1/6, p(1,0)=p(1,1)=1/3 , p(2,2)=1/6 and p(x,y)=0 for any other (x,y). a)…
A: Note: Hi, thank you for the question. As per our company guideline we are supposed to answer only…
Q: Ho: μ = 76.6 Ha: μ # 76.6 You believe the population is normally distributed, but you do not know…
A:
Q: 6) Suppose an employer allows its employees up to five "personal" days per year. Let random variable…
A: The provided information is a. X Frequency (f) P(X)=f*X cf 0 15 0 15 1 40 40 55 2 28 56…
Q: Vaccinated first born? Yes No Total Vaccinated both parents? Yes No 10 (10.5) 5 (4.5) 15 4 (3.5) 1…
A: The observed and the expected frequencies are given in the table. The researcher is interested to…
Q: An analyst of EDSA Sang Hotel sampled 20 customers from last year's records and found out that the…
A: The question is about t test for difference between two pop. means Given : Sample no. of customers…
Q: Describe type I and type II errors for a hypothesis test of the indicated claim. A public works…
A: A public works department publicizes that at least 50% of applicants become groundskeepers
Q: Suppose X, Y and Z be random variables with j.p.m.f. f(x, y, z)= kxyz with x E {1,2}, y = {1, 2, 3),…
A: Given information: The value of k is obtained below:
Q: that the event will fa
A: We know that the, if probability of occurrence of an event is m/n then odd against the event, is…
Q: 1. The average number of cycles of charging of rechargeable batteries manufactures in a certain…
A:
Q: Suppose a variable xx is N.d. with standard deviation σ=22. An SRS of 4 observations has sample mean…
A: Suppose the variable of interest is X.
Q: Taxes: The Internal Revenue Service reports that the mean federal income tax paid in the year 2010…
A: Answer : - Given, Mean( μ)= 8040 , standard deviation(σ)= 4800 , sample size (n)=1000 (a)…
Q: The following table shows a company's annual revenue (in billions of dollars) for 2009 to 2014.…
A:
Q: 19. Mrs. Cruz gives a multiple-choice item in the summative test in Mathematics. The scores of the…
A: Solution: Class Class Boundries Frequencyf cf 21 - 25 20.5 - 25.5 61 61 26 -…
Q: A simple random sample of 56 students who picked up all tests they completed was selected, and the…
A: Confidence interval is used to determine the parameter range where it lies. It explains true mean…
Q: Suppose that we compute a 90% confidence interval for an unknown population mean μ. Which of the…
A: Assume that µ is the population mean.
Q: likelihood that three out of fifteen randomly selected responders drink at least seven glasses of…
A: here given , The population of 15 individuals who participated in the study reported a mean of…
Q: A laboratory in Arizona is interested in finding the mean chloride level for a healthy resident in…
A: GivenMean(x)=103standard deviation(σ)=45sample size(n)=100confidence level=90%
Q: pothesis? tive manufacturer claims that the standard deviation for the gas mileage of one of the…
A:
Q: Problem 0.1: A factory manufactures a specific copper part. It is found at a certain temperature the…
A:
Q: A simple random sample of 56 students who picked up all tests they completed was selected, and the…
A: Given that Sample sizes n1 =56 ,n2=51
Q: 1) Consider the experiment consists of two independent rolls of a 4-sided f random variable which is…
A: As per our guidelines, we have provided answer for first 3 sub-parts only. Please repost other…
Q: According to a report on sleep deprivation by the Centers for Disease Control and Prevention, the…
A: From the provided information,
Q: Match the vocabulary with the correct definition. The characteristics of interest, determining the…
A:
Q: A multiple choice exam has 4 choices for each question. A student has studied enough so that the…
A: Given that: The probability that student will know the answer = 0.5 The probability that a student…
Q: UPVOTE will be given! STATISTICS AND PROBABILITY MULTIPLE CHOICE A consumer group believes that…
A: Given,n=800x=260p^=xnp^=260800=0.325population proportion(P)=0.30α=0.10
Q: 58//n Sampling distribution Suppose population 1 is all blue cars sold at used car auctions, and the…
A: Given that Suppose population 1 is all blue cars sold at used car auctions, and the mean sale price…
Q: Suppose that the table shows the COVID-19 cases and deaths in some NCR cities during the COVID-19…
A:
Q: 1. * O Let X-F(4,8), then 1. The value of E(X) is A A. 1.43 C. 1.53 B B. 1.33
A: The question is about F distribution Given : X ~ F ( 4, 8 )
Q: Calculate the correlation coefficient, r, for the data below. x-14 -12 -5 -8 -10 -11 -9 -7 -6 -13 -…
A: Given data is x -14 -12 -5 -8 -10 -11 -9 -7 -6 -13 y -1 1 18 10 7 3 8 12 15 1
Q: A study was done on proctored and nonproctored tests. The results are shown in the table. Assume…
A: Solution Given
Q: Why is it correct to say "a" normal distribution and "the" standard normal distribution? ZIDE…
A: To find: Why is it correct to say "a" normal distribution and "the" standard normal distribution?
Q: Which is not true about random sampling? A.it is a process used to draw a subset of subjects from…
A: The objective is to identify the statement that is not true about random sampling.
Q: Describe each of the multivariate distributions: a) Multinomial distribution b) Generalized…
A:
Q: Suppose that buses arrive are scheduled to arrive at a bus stop at noon but are always X minutes…
A:
Q: A sample of the length in inches for newborns is given below. Assume that lengths are normally…
A:
Q: A machine gun shoots for 3 seconds at the rate of 2400 bullets/minute. The probability of a bullet…
A:
Q: Time to review: The following table presents the time taken to review articles that were submitted…
A:
Step by step
Solved in 2 steps with 4 images
- A school psychologist notes that the average number of times that students are disrup- tive during class is 1.4 (u 1.4] times per day Following recent classroom policy changes the psychologist tests if the number of disrup- tions during class has changed. He records the following number of disruptions observed during a class day: 2, 4,3, 5, 4, 1, 1, and 4 1. Test the hypothesis that the number of complaints has increased or decreased using a .05 level of significance. State the value for the test stastistic and the decision to retain or rejct the null hypothesis. 2.compute effect size using estimated Cohen's D.Develop two research hypotheses: (a) one that would be used to examine differences between two unrelated groups and (b) one that would examine differences between two dependent groups.#2. The following data show the educational level and productivity of 20 employees in the City of Fullerton Social Services Agency. Set up a contingency table on education and productivity and analyze your table to explain if there is a relationship between employee education and productivity. Education: SC = some college, BA = bachelor’s, MA = master’s Productivity = number of cases completed per week by the employee
- 10.32 The Society for Human Resource Management (SHRM) collaborated with Globoforce on a series of organizational surveys with the goal of identifying challenges that HR leaders face and what strategies help them conquer those challenges. A recent survey indicates that employee retention/turnover (46%) and employee engagement (36%) were cited as the most important organizational challenges currently faced by HR professionals.One strategy that may have an impact on employee retention, turnover, and engagement is a successful employee recognition program. Surveying small organizations, those with 500 to 2,499 employees, and large organizations, those with 10,000 or more employees, SHRM and Globoforce showed that 326 (77%) of the 423 small organizations have employee retention programs as compared to 167 (87%) of the 192 large organizations.Source: Data extracted from SHRM Survey Finding: Influencing Workplace Culture Through Employee Retention and Other Efforts, bit.ly/2rFvE9w. a. At…A report stated that based on observing a large number of vehicle occupants, the estimated percentage of drivers and passengers in a certain country who wear seatbelts is 83.2%. The report also gave information on seat belt use by sex and by whether the vehicle is traveling in an urban or rural area. The information in the following table is consistent with summary values given in the report. Urban Areas Rural Areas Male Female Male Female Seat belt 851 908 750 817 No Seat belt 149 92 250 183 Assume that these data are representative of drivers and passengers in the country. Consider the following conclusion. Females are more likely to wear seat belts than males in both urban and rural areas. The difference in the percentage of females and the percentage of males who wear seat belts is greater for rural areas than for urban areas. Provide a justification for this conclusion. Use the information in the table to calculate relevant probabilities. The differences in the proportions for…A developmental psychologist who wanted to know if the age when children started walking affected school performance divided 48 children into 16-Early, 16-Middle, and 16-Late Walkers. At the end of the second grade, the psychologist computed a composite school performance score based on teachers' reports. The means and estimated population variances for the three groups were: Early Walkers: M = 33, 52 = 25; Middle Walkers: M = 42 52 = 36; Late Walkers: M = 42. 52 = 16. a.) Is there a difference in school performance score between three walking groups? (Use the.05 level.) Use the five steps of hypothesis testing. Label all the steps clearly. Show ALL Work/calculations. b.) Report the statistic in APA format (the statistical sentence).
- To be more certain that a treatment actually does have an effect (instead of making a Type I error), a researcher should use a larger value for α. Group of answer choices True FalseIs the transportation mode used to ship goods independent of type of industry?Suppose the following contingency table represents frequency counts of types of transportation used by the publishing and computer hardware industries.Analyze the data by using relevant test to determine whether type of industry is independent of transportation mode at 5%level of significance. Transportation Mode Air Train Truck Publishing 32 12 41 Hardware 5 6 24A professor found out from a senior professor that engineering students in Harp University tend to do good in their Engineering Management subject, claiming that historically, the mean grade of engineering students in the said course is 1.50. Curious if this claim was true, the professor took a random sample of 9 students who took the engineering management subject. Before collecting data, he was undecided about his own claim because he knew of some students who did really good in the course but has also encountered others who did poorly. He found that their mean grade for the course is 1.35 with a standard deviation of 0.50. Use the Test of Significance Approach in testing the professor’s claim. a. Estimate population mean at 90% confidence interval. b. Between z and t, which is more appropriate to use given the data? Why? c. What are the chances that your estimate of population mean was wrong? Describe and explain a potential source of error to your estimate. d. Holding % of CI…
- Do well-rounded people get fewer colds? A study on the Chronicle of Higher Education was conducted by scientist at Carnegie Mellon University, the University of Pittsburgh and the University of Virginia. They found that people who have only a few social outlets get more colds than those who are involved in a variety of social activities. Suppose that of the 276 healthy men and women tested, n1=96 had only a few social outlets and n2=105 were busy with six or more activities. When these people were exposed to a cold virus, the following results were observed: Construct a 99% confidence interval for the difference in the two population proportions.Some research has shown that older parents are not as strict when disciplining their children compared to younger parents. Children of older parents are more likely to be in daycare and have greater independence than children of younger parents, whereas children of younger parents are more likely to be at home with parents and other siblings, and encounter more home discipline. A researcher observed the disciplinary habits of 456 families with at least one child, categorizing each as "high" or "low" in terms of disciplinary strictness. The families were also divided into older parents (those 29 years of age or younger) and older parents (30 years old and up). Are the following data consistent with the hypothesis that older parents are not as strict when disciplining their children? Calculate gamma and interpret it's direction and magnitude, and summarize your findings in a few sentences. Level of discipline Parental age 29 years or younger 30 years or…City planners believe that larger cities are populated by older residents. To investigate the relationship, data on population and median age in 10 large cities were collected. City Population City(in millions) Median age Chicago, IL 2.833 31.5 Dallas, TX 1.233 30.5 Houston, TX 2.144 30.9 Los Angeles, CA 3.849 31.6 New York, NY 8.214 34.2 Philadelphia, PA 1.448 34.2 Phoenix, AZ 1.513 30.7 San Antonio, TX 1.297 31.7 San Diego, CA 1.257 32.5 San Jose, CA 0.930 32.6 Click here for the Excel Data File Draw a scatter diagram. On the graph below, use the point tool to plot the point corresponding to the first Population City and its Median age(Population 1). Repeat the process for the remainder of the sample (Population 2, Population 3, … ). To enter exact coordinates, double-click on the point and enter the exact coordinates of x and y. Find the correlation coefficient. (Round your answer to 3 decimal places.)…