A supplier of silicone sheets for producers of computer chips wants to evaluate her manufacturing process. She takes sample sizes of 5 from each day's output and counts the number of blemishes on each silicone shee 5 6 10 The results from 20 days of such evaluations are provided. She also decides that the upper specification limit is 10 blemishes. Determine if the statement is true or false. Based on the R chart, it appears that the process is out of control. E Click the icon to view the silicone sheet blemish data. Silicone Sheet Blemish Data Day 1 2 3 4 5 Mean Range O True 8 10 6 6. 12 7 9 12 7 1 14 5 10 8.6 8.6 9 7 6. O False 2 8. 13 3 10 7 9 10 9 8.6 5 7 4 8. 8 6. 10 7.6 7 6 7 9 6. 9 8 10 5 10 6. 10 7 7.6 8 9 10 6 5 10 6 6 8 4 10 11 9 8 6 8 8. 6 4 7.4 3 6. 10 10 7.8 5 12 7 7 12 7.2 8. 7 5 7 6 9 5 8 8 7 6 7 12 10 6 13 6.8 4 14 3 6.8 9 15 7 10 6 16 7 11 4 7 7.4 5.6 7 17 4 5 4 7 4 11 10 4 11 10 10 10 6 18 11 94 84 7 19 6 4 20 6 12 12 6 8 8.8 6
A supplier of silicone sheets for producers of computer chips wants to evaluate her manufacturing process. She takes sample sizes of 5 from each day's output and counts the number of blemishes on each silicone shee 5 6 10 The results from 20 days of such evaluations are provided. She also decides that the upper specification limit is 10 blemishes. Determine if the statement is true or false. Based on the R chart, it appears that the process is out of control. E Click the icon to view the silicone sheet blemish data. Silicone Sheet Blemish Data Day 1 2 3 4 5 Mean Range O True 8 10 6 6. 12 7 9 12 7 1 14 5 10 8.6 8.6 9 7 6. O False 2 8. 13 3 10 7 9 10 9 8.6 5 7 4 8. 8 6. 10 7.6 7 6 7 9 6. 9 8 10 5 10 6. 10 7 7.6 8 9 10 6 5 10 6 6 8 4 10 11 9 8 6 8 8. 6 4 7.4 3 6. 10 10 7.8 5 12 7 7 12 7.2 8. 7 5 7 6 9 5 8 8 7 6 7 12 10 6 13 6.8 4 14 3 6.8 9 15 7 10 6 16 7 11 4 7 7.4 5.6 7 17 4 5 4 7 4 11 10 4 11 10 10 10 6 18 11 94 84 7 19 6 4 20 6 12 12 6 8 8.8 6

Functions and Change: A Modeling Approach to College Algebra (MindTap Course List)
6th Edition
ISBN:9781337111348
Author:Bruce Crauder, Benny Evans, Alan Noell
Publisher:Bruce Crauder, Benny Evans, Alan Noell
Chapter1: Functions
Section1.2: Functions Given By Tables
Problem 2TU: Use the table of values you made in part 4 of the example to find the limiting value of the average...

Related questions
Question
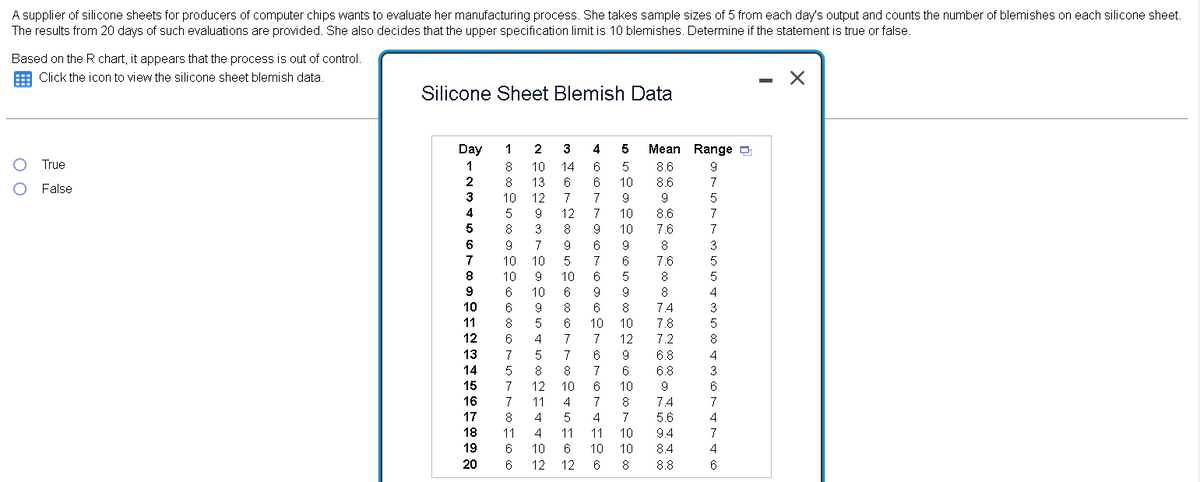
Transcribed Image Text:A supplier of silicone sheets for producers of computer chips wants to evaluate her manufacturing process. She takes sample sizes of 5 from each day's output and counts the number of blemishes on each silicone sheet.
The results from 20 days of such evaluations are provided. She also decides that the upper specification limit is 10 blemishes. Determine if the statement is true or false.
Based on the R chart, it appears that the process is out of control.
E Click the icon to view the silicone sheet blemish data.
Silicone Sheet Blemish Data
Day
1
2
3
4
5
Mean Range O
True
1
8
10
14
6
5
8.6
9
2
8
13
10
8.6
7
False
3
10
12
7
7
9
4
12
7
10
8.6
7
5
8
3
8
9
10
7.6
7
6
9
7
9.
6
9
8
3
7
10
10
7
6
7.6
10
9
10
6
8
5
6
10
6
9
9
8
4
10
6
9
8
6
8
7.4
3
11
8
6
10
10
7.8
12
6
4
7
7
12
7.2
8
13
7
7
6.8
4
14
8
7
6
6.8
3
15
7
12
10
6
10
9
6
16
7
11
4
7
8
7.4
7
17
8
4
5
4
7
5.6
4
18
11
4
11
11
10
9.4
7
19
6
10
6
10
10
8.4
4
20
6
12
12
6
8
8.8
6
Expert Solution
This question has been solved!
Explore an expertly crafted, step-by-step solution for a thorough understanding of key concepts.

Step by step
Solved in 2 steps

Recommended textbooks for you
Functions and Change: A Modeling Approach to Coll…
Algebra
ISBN:
9781337111348
Author:
Bruce Crauder, Benny Evans, Alan Noell
Publisher:
Cengage Learning
Functions and Change: A Modeling Approach to Coll…
Algebra
ISBN:
9781337111348
Author:
Bruce Crauder, Benny Evans, Alan Noell
Publisher:
Cengage Learning