A surgery center specializes in high-risk cardiovascular surgery. The center needs to forecast its profitability over the next three years to plan for capital growth projects. Find the distribution of the net present value of profit over the three-year horizon and analyze the summary statistics using 50 trials. Summarize your conclusions. Use a discount rate of 3%. Click here to view the descriptions of the model. Click here to view a sample of 50 simulation trial results. Set up a spreadsheet model and calculate the net present value for the profits in thousands of dollars using the minimum for uncertain values with uniform distributions, the mean for uncertain values with normal distributions, and the most likely values for uncertain values with triangular distributions. The net present value is $ thousand. (Round to the nearest thousand dollars as needed.) Based on the provided simulations, the mean net present value of the profits over the next three years is $[ (Round to the nearest thousand dollars as needed.) thousand, the standard deviation is $ thousand, the minimum is $ thousand, and the maximum is $ thousand. Model description For the first year, the anticipated number of patients served is uniform between 1,200 and 1,700. The growth rate for subsequent years is triangular with parameters (5%, 8%, 9%). and the growth rate for year 2 is independent of the growth rate for year 3. Average billing is normal with mean of $150,000 and standard deviation $12,000. However, because of managed care, the center collects only 30% of billings. Variable costs for supplies and drugs are calculated to be 10% of billings. Fixed costs for salaries, utilities, and so on will amount to $20,000,000 in the first year and the annual increase in fixed costs is uniform between 4% and 6% and independent of other years. Print Done Simulation Results Trial NPV 1 80,844 2 71,397 3 60,385 4 77,655 5 83,515 6 50,167 7 77,758 8 49,723 9 66,184 10 70,500 11 84,583 12 50,616 13 81,072 14 92,008 15 99,227 16 91,837 17 62,394 18 41,475 19 68,237 20 94,945 21 88,951 22 73,227 - X
A surgery center specializes in high-risk cardiovascular surgery. The center needs to forecast its profitability over the next three years to plan for capital growth projects. Find the distribution of the net present value of profit over the three-year horizon and analyze the summary statistics using 50 trials. Summarize your conclusions. Use a discount rate of 3%. Click here to view the descriptions of the model. Click here to view a sample of 50 simulation trial results. Set up a spreadsheet model and calculate the net present value for the profits in thousands of dollars using the minimum for uncertain values with uniform distributions, the mean for uncertain values with normal distributions, and the most likely values for uncertain values with triangular distributions. The net present value is $ thousand. (Round to the nearest thousand dollars as needed.) Based on the provided simulations, the mean net present value of the profits over the next three years is $[ (Round to the nearest thousand dollars as needed.) thousand, the standard deviation is $ thousand, the minimum is $ thousand, and the maximum is $ thousand. Model description For the first year, the anticipated number of patients served is uniform between 1,200 and 1,700. The growth rate for subsequent years is triangular with parameters (5%, 8%, 9%). and the growth rate for year 2 is independent of the growth rate for year 3. Average billing is normal with mean of $150,000 and standard deviation $12,000. However, because of managed care, the center collects only 30% of billings. Variable costs for supplies and drugs are calculated to be 10% of billings. Fixed costs for salaries, utilities, and so on will amount to $20,000,000 in the first year and the annual increase in fixed costs is uniform between 4% and 6% and independent of other years. Print Done Simulation Results Trial NPV 1 80,844 2 71,397 3 60,385 4 77,655 5 83,515 6 50,167 7 77,758 8 49,723 9 66,184 10 70,500 11 84,583 12 50,616 13 81,072 14 92,008 15 99,227 16 91,837 17 62,394 18 41,475 19 68,237 20 94,945 21 88,951 22 73,227 - X

Managerial Economics: Applications, Strategies and Tactics (MindTap Course List)
14th Edition
ISBN:9781305506381
Author:James R. McGuigan, R. Charles Moyer, Frederick H.deB. Harris
Publisher:James R. McGuigan, R. Charles Moyer, Frederick H.deB. Harris
Chapter5: Business And Economic Forecasting
Section: Chapter Questions
Problem 1E: The forecasting staff for the Prizer Corporation has developed a model to predict sales of its...

Related questions
Question
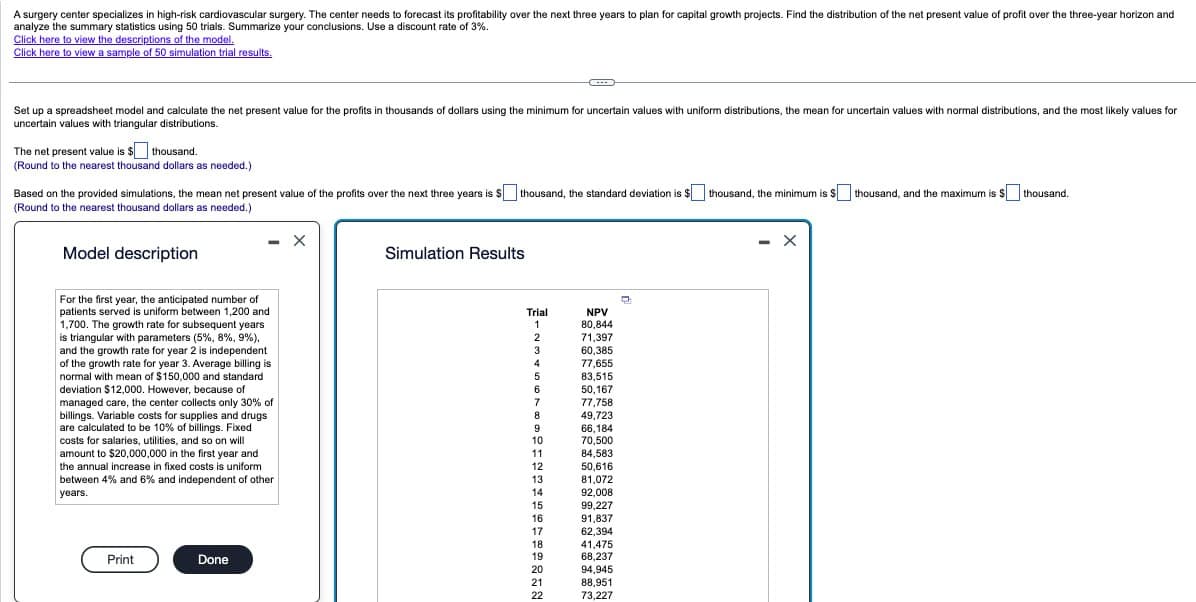
Transcribed Image Text:A surgery center specializes in high-risk cardiovascular surgery. The center needs to forecast its profitability over the next three years to plan for capital growth projects. Find the distribution of the net present value of profit over the three-year horizon and
analyze the summary statistics using 50 trials. Summarize your conclusions. Use a discount rate of 3%.
Click here to view the descriptions of the model.
Click here to view a sample of 50 simulation trial results.
Set up a spreadsheet model and calculate the net present value for the profits in thousands of dollars using the minimum for uncertain values with uniform distributions, the mean for uncertain values with normal distributions, and the most likely values for
uncertain values with triangular distributions.
The net present value is $
thousand.
(Round to the nearest thousand dollars as needed.)
Based on the provided simulations, the mean net present value of the profits over the next three years is $[
(Round to the nearest thousand dollars as needed.)
thousand, the standard deviation is $
thousand, the minimum is $
thousand, and the maximum is $
thousand.
Model description
For the first year, the anticipated number of
patients served is uniform between 1,200 and
1,700. The growth rate for subsequent years
is triangular with parameters (5%, 8%, 9%).
and the growth rate for year 2 is independent
of the growth rate for year 3. Average billing is
normal with mean of $150,000 and standard
deviation $12,000. However, because of
managed care, the center collects only 30% of
billings. Variable costs for supplies and drugs
are calculated to be 10% of billings. Fixed
costs for salaries, utilities, and so on will
amount to $20,000,000 in the first year and
the annual increase in fixed costs is uniform
between 4% and 6% and independent of other
years.
Print
Done
Simulation Results
Trial
NPV
1
80,844
2
71,397
3
60,385
4
77,655
5
83,515
6
50,167
7
77,758
8
49,723
9
66,184
10
70,500
11
84,583
12
50,616
13
81,072
14
92,008
15
99,227
16
91,837
17
62,394
18
41,475
19
68,237
20
94,945
21
88,951
22
73,227
- X
Expert Solution
This question has been solved!
Explore an expertly crafted, step-by-step solution for a thorough understanding of key concepts.

Step by step
Solved in 2 steps

Recommended textbooks for you
Managerial Economics: Applications, Strategies an…
Economics
ISBN:
9781305506381
Author:
James R. McGuigan, R. Charles Moyer, Frederick H.deB. Harris
Publisher:
Cengage Learning
Managerial Economics: Applications, Strategies an…
Economics
ISBN:
9781305506381
Author:
James R. McGuigan, R. Charles Moyer, Frederick H.deB. Harris
Publisher:
Cengage Learning