A survey of 800 women shoppers found that 17% of them shop on impulse What is the 98% confidence interval for the true proportion of women shoppers who shop on impulse? O A 0.167
A survey of 800 women shoppers found that 17% of them shop on impulse What is the 98% confidence interval for the true proportion of women shoppers who shop on impulse? O A 0.167

Holt Mcdougal Larson Pre-algebra: Student Edition 2012
1st Edition
ISBN:9780547587776
Author:HOLT MCDOUGAL
Publisher:HOLT MCDOUGAL
Chapter11: Data Analysis And Probability
Section: Chapter Questions
Problem 8CR

Related questions
Question
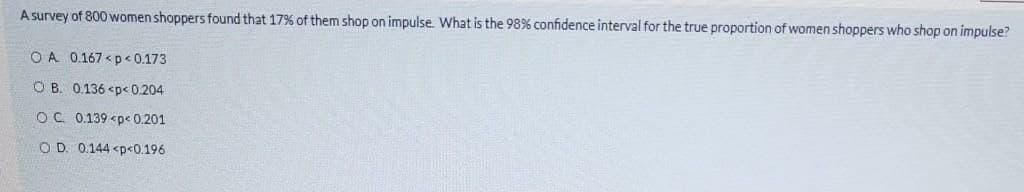
Transcribed Image Text:A survey of 800 women shoppers found that 17% of them shop on impulse What is the 98% confidence interval for the true proportion of women shoppers who shop on impulse?
O A 0.167 <p< 0.173
O B. 0.136 <p<0.204
OC 0.139 <pc 0.201
O D. 0.144 <p<0.196
Expert Solution
This question has been solved!
Explore an expertly crafted, step-by-step solution for a thorough understanding of key concepts.

Step by step
Solved in 2 steps with 2 images

Recommended textbooks for you
Holt Mcdougal Larson Pre-algebra: Student Edition…
Algebra
ISBN:
9780547587776
Author:
HOLT MCDOUGAL
Publisher:
HOLT MCDOUGAL

Holt Mcdougal Larson Pre-algebra: Student Edition…
Algebra
ISBN:
9780547587776
Author:
HOLT MCDOUGAL
Publisher:
HOLT MCDOUGAL