A survey of major universities asked what percentage of incoming freshmen usually graduate "on time" in 4 years. Use the summary statistics given to answer the questions. a) Would you describe this distribution as symmetric or skewed? Explain O A. This distribution is skewed, because the mean and median are not reasonably close to one another O B. This distribution is symmetric, because the mean and median are reasonably close to one another and the extreme values are approximately the same distance from the fences. % on time Count Mean 48 68.72 68 86 OC. This distribution is symmetric, because the mean and median are reasonably close to one another and the quartiles are approximately the same distance from the mean. Median StdDev 10.16 Min 44.65 b) Are there any outliers? Explain, Маx 85.36 Range 25th %tile 40.71 60 13 O A. Yes, because the maximum value in the distribution is greafer than the upper fence 75th %tile 75.75 O B. Yes, because the minimum value in the distribution is less than the lower fence and the maximum value is greater than the upper fence O C. Yes, because the minimum value in the distribution is less than the lower fence O D. No, because all the values in the distribution are between the fences. c) Create a boxplot of these data Choose the correct boxplot below. OA. OB Q 90 80- 70 60- 50- 40 100 60 40- 20- Oc. OD.
A survey of major universities asked what percentage of incoming freshmen usually graduate "on time" in 4 years. Use the summary statistics given to answer the questions. a) Would you describe this distribution as symmetric or skewed? Explain O A. This distribution is skewed, because the mean and median are not reasonably close to one another O B. This distribution is symmetric, because the mean and median are reasonably close to one another and the extreme values are approximately the same distance from the fences. % on time Count Mean 48 68.72 68 86 OC. This distribution is symmetric, because the mean and median are reasonably close to one another and the quartiles are approximately the same distance from the mean. Median StdDev 10.16 Min 44.65 b) Are there any outliers? Explain, Маx 85.36 Range 25th %tile 40.71 60 13 O A. Yes, because the maximum value in the distribution is greafer than the upper fence 75th %tile 75.75 O B. Yes, because the minimum value in the distribution is less than the lower fence and the maximum value is greater than the upper fence O C. Yes, because the minimum value in the distribution is less than the lower fence O D. No, because all the values in the distribution are between the fences. c) Create a boxplot of these data Choose the correct boxplot below. OA. OB Q 90 80- 70 60- 50- 40 100 60 40- 20- Oc. OD.

Glencoe Algebra 1, Student Edition, 9780079039897, 0079039898, 2018
18th Edition
ISBN:9780079039897
Author:Carter
Publisher:Carter
Chapter10: Statistics
Section10.4: Distributions Of Data
Problem 19PFA

Related questions
Question
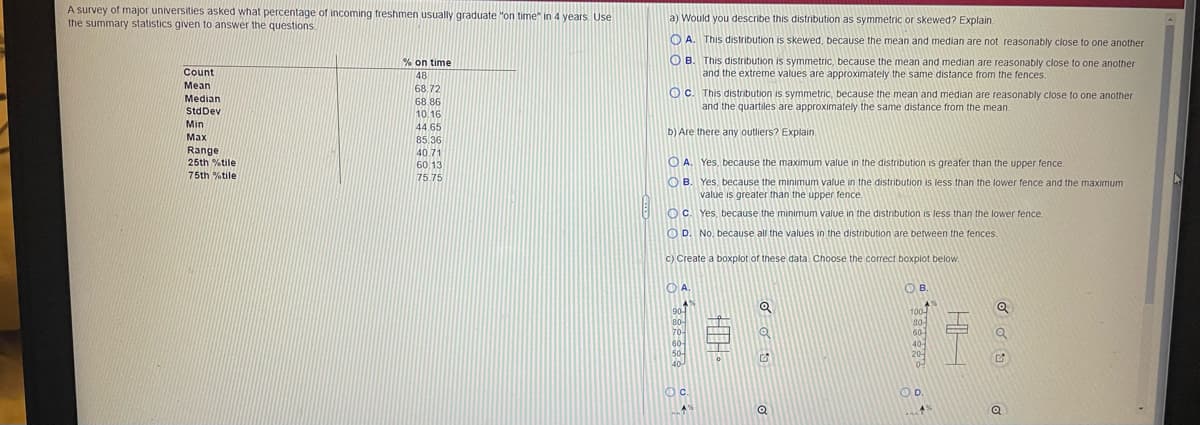
Transcribed Image Text:A survey of major universities asked what percentage of incoming freshmen usually graduate "on time" in 4 years. Use
the summary statistics given to answer the questions.
a) Would you describe this distribution as symmetric or skewed? Explain.
O A. This distribution is skewed, because the mean and median are not reasonably close to one another.
OB.
O B. This distribution is symmetric, because the mean and median are reasonably close to one another
and the extreme values are approximately the same distance from the fences.
% on time
Count
48
Мean
68.72
OC. This distribution is symmetric, because the mean and median are reasonably close to one another
and the quartiles are approximately the same distance from the mean.
Median
68.86
10.16
StdDev
Min
44.65
b) Are there any outliers? Explain,
Маx
85.36
Range
25th %tile
40.71
60,13
O A. Yes, because the maximum value in the distribution is greater than the upper fence.
75th %tile
75.75
O B. Yes, because the minimum value in the distribution is less than the lower fence and the maximum
value is greater than the upper fence.
O C. Yes, because the minimum value in the distribution is less than the lower fence.
O D. No, because all the values in the distribution are between the fences.
C) Create a boxplot of these data. Choose the correct boxplot below.
OA.
100
80
60-
90
80-
70-
60-
50-
40
40-
20-
Oc.
OD.
Expert Solution
Step 1
Part (a) and (b) is visible
Given:
Descriptive statistics

Trending now
This is a popular solution!

Step by step
Solved in 2 steps

Recommended textbooks for you
Glencoe Algebra 1, Student Edition, 9780079039897…
Algebra
ISBN:
9780079039897
Author:
Carter
Publisher:
McGraw Hill

Big Ideas Math A Bridge To Success Algebra 1: Stu…
Algebra
ISBN:
9781680331141
Author:
HOUGHTON MIFFLIN HARCOURT
Publisher:
Houghton Mifflin Harcourt
Glencoe Algebra 1, Student Edition, 9780079039897…
Algebra
ISBN:
9780079039897
Author:
Carter
Publisher:
McGraw Hill
Big Ideas Math A Bridge To Success Algebra 1: Stu…
Algebra
ISBN:
9781680331141
Author:
HOUGHTON MIFFLIN HARCOURT
Publisher:
Houghton Mifflin Harcourt