* A survey of the white and nonwhlte population In a local area reveals the following annual trip frequencies to the nearest state park: = 4.1, I = 3.1, si = 14.3, s= 12.0, n, = 20 n2 = 16 where the subscript '1' denotes the white population and the subscript '2' denotes the nonwhite population. a. Assume that the variances are equal, and test the null hypothesis that there is no difference between the park-going frequencies of whites and nonwhites. b. Repeat the exercise, assuming that the variances are unequal. C. Find the p-value associated with the tests in parts (a) and d. Associated with the test in part (a), find a 95% confidence interval for the difference in means
* A survey of the white and nonwhlte population In a local area reveals the following annual trip frequencies to the nearest state park: = 4.1, I = 3.1, si = 14.3, s= 12.0, n, = 20 n2 = 16 where the subscript '1' denotes the white population and the subscript '2' denotes the nonwhite population. a. Assume that the variances are equal, and test the null hypothesis that there is no difference between the park-going frequencies of whites and nonwhites. b. Repeat the exercise, assuming that the variances are unequal. C. Find the p-value associated with the tests in parts (a) and d. Associated with the test in part (a), find a 95% confidence interval for the difference in means

Glencoe Algebra 1, Student Edition, 9780079039897, 0079039898, 2018
18th Edition
ISBN:9780079039897
Author:Carter
Publisher:Carter
Chapter10: Statistics
Section10.6: Summarizing Categorical Data
Problem 10CYU

Related questions
Question
im not sure how to find test statistic for question 7
Transcribed Image Text:->
O YouTube
N Netflix D Disney+
2 WhatsApp
OLD
Apps M Gmail
9a574d1b-1963-4c...
2 / 5
100%
+
日の
INFERENTIAL STATISTICS
183
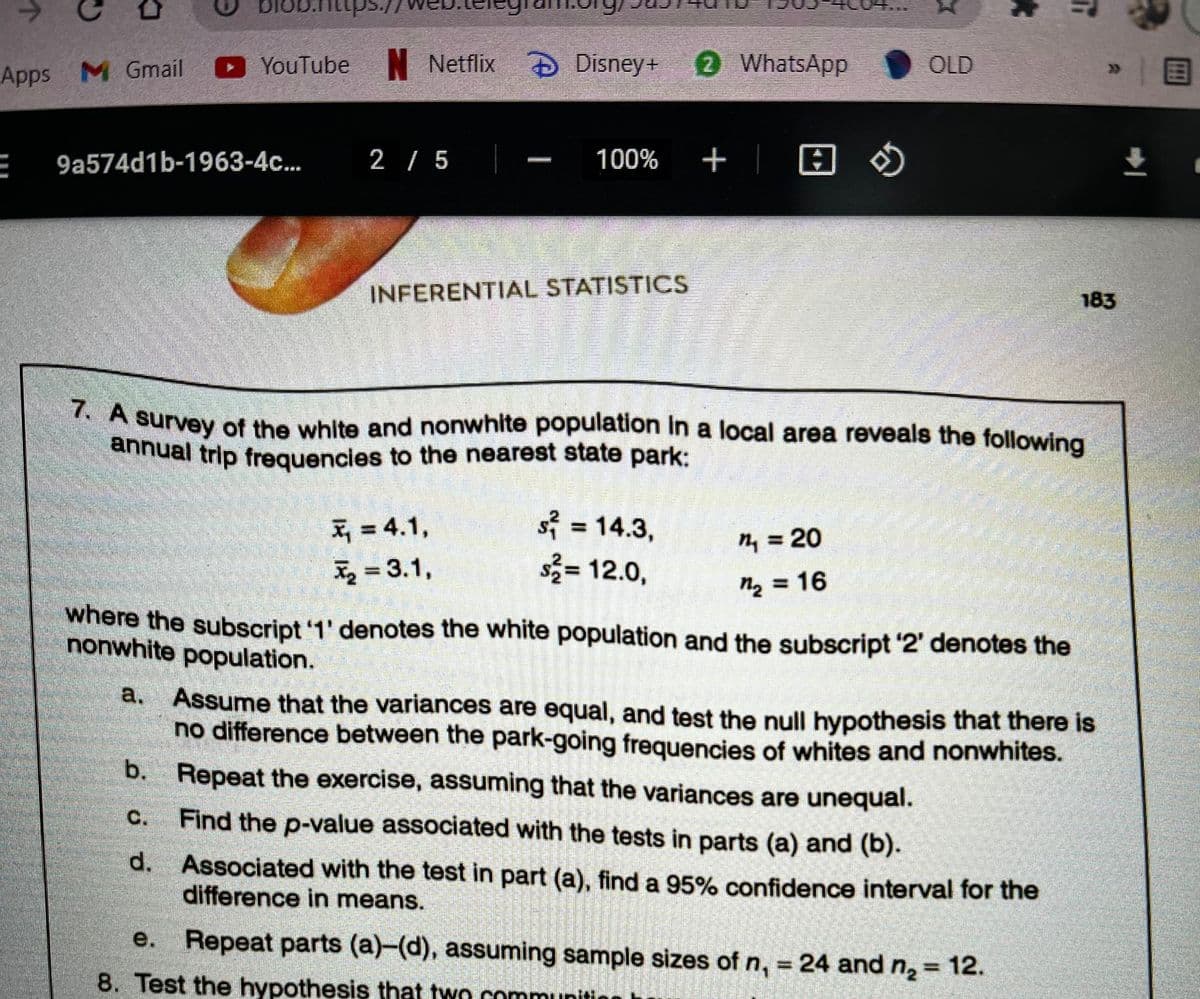
A survey of the white and nonwhite population In a local area reveals the following
anhual trip frequencies to the nearest state park:
X, = 4.1,
Iz = 3.1,
si = 14.3,
s= 12.0,
%3D
ny = 20
ną =16
where the subscript '1' denotes the white population and the subscript '2' denotes the
nonwhite population.
Assume that the variances are equal, and test the null hypothesis that there is
no difference between the park-going frequencies of whites and nonwhites.
b. Repeat the exercise, assuming that the variances are unequal.
a.
C.
Find the p-value associated with the tests in parts (a) and (b).
d. Associated with the test in part (a), find a 95% confidence interval for the
difference in means.
е.
Repeat parts (a)-(d), assuming sample sizes of n, = 24 and n, 12.
8. Test the hypothesis that two communitio
Expert Solution
This question has been solved!
Explore an expertly crafted, step-by-step solution for a thorough understanding of key concepts.

This is a popular solution!

Trending now
This is a popular solution!

Step by step
Solved in 2 steps

Recommended textbooks for you
Glencoe Algebra 1, Student Edition, 9780079039897…
Algebra
ISBN:
9780079039897
Author:
Carter
Publisher:
McGraw Hill

Algebra & Trigonometry with Analytic Geometry
Algebra
ISBN:
9781133382119
Author:
Swokowski
Publisher:
Cengage

Holt Mcdougal Larson Pre-algebra: Student Edition…
Algebra
ISBN:
9780547587776
Author:
HOLT MCDOUGAL
Publisher:
HOLT MCDOUGAL
Glencoe Algebra 1, Student Edition, 9780079039897…
Algebra
ISBN:
9780079039897
Author:
Carter
Publisher:
McGraw Hill
Algebra & Trigonometry with Analytic Geometry
Algebra
ISBN:
9781133382119
Author:
Swokowski
Publisher:
Cengage
Holt Mcdougal Larson Pre-algebra: Student Edition…
Algebra
ISBN:
9780547587776
Author:
HOLT MCDOUGAL
Publisher:
HOLT MCDOUGAL