Q.4 Calculate the Variance and standard deviation from the following data Daily wages (Rs.) 400-450 450-500 500-550 | 550-600 600-650 650-700 No. of workers 20 30 50 25 20 5
Q.4 Calculate the Variance and standard deviation from the following data Daily wages (Rs.) 400-450 450-500 500-550 | 550-600 600-650 650-700 No. of workers 20 30 50 25 20 5

Glencoe Algebra 1, Student Edition, 9780079039897, 0079039898, 2018
18th Edition
ISBN:9780079039897
Author:Carter
Publisher:Carter
Chapter10: Statistics
Section10.4: Distributions Of Data
Problem 19PFA

Related questions
Question
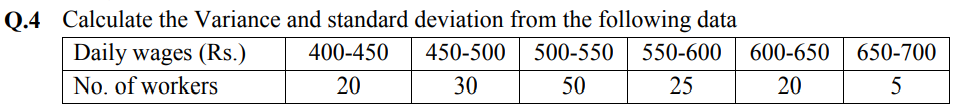
Transcribed Image Text:Q.4 Calculate the Variance and standard deviation from the following data
Daily wages (Rs.)
No. of workers
400-450
450-500
500-550
550-600
600-650
650-700
20
30
50
25
20
5
Expert Solution
This question has been solved!
Explore an expertly crafted, step-by-step solution for a thorough understanding of key concepts.

Step by step
Solved in 2 steps

Recommended textbooks for you
Glencoe Algebra 1, Student Edition, 9780079039897…
Algebra
ISBN:
9780079039897
Author:
Carter
Publisher:
McGraw Hill
Glencoe Algebra 1, Student Edition, 9780079039897…
Algebra
ISBN:
9780079039897
Author:
Carter
Publisher:
McGraw Hill