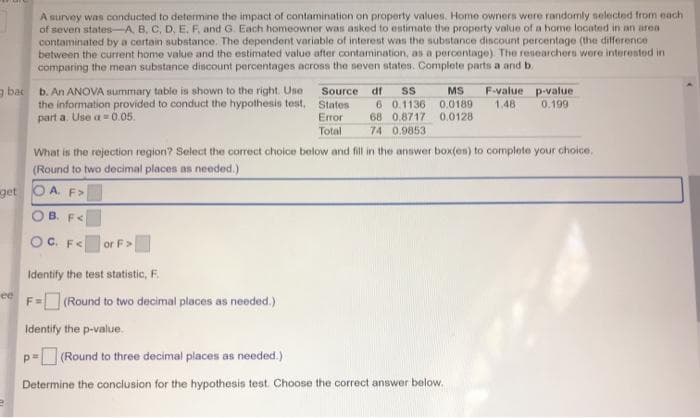
A survey was conducted to determine the impact of contamination on property values. Home owners were randomly selected from ea of seven states-A. B, C, D, E, F. and G. Each homeowner was asked to estimate the property value of a home located in an area contaminated by a certain substance. The dependent variable of interest was the substance discount percentage (the difference between the current home value and the estimated value after contamination, as a percentage) The researchers were interested in comparing the mean substance discount percentages across the seven states. Complete parts a and b. b. An ANOVA summary table is shown to the right. Use the information provided to conduct the hypothesis test, States part a. Use a-0.05. MS 0.0189 Source df F-value p-value 1.48 0.199 6 0.1136 68 0.8717 74 0.9853 Error 0.0128 Total What is the rejection region? Select the correct choice below and fill in the answer box(es) to complete your choice. (Round to two decimal places as needed.) O A. F> OB. F< OC. F< or F> Identify the test statistic, F. F- (Round to two decimal places as needed.) Identify the p-value. p%3D(Round to three decimal places as needed.) Determine the conclusion for the hypothesis test. Choose the correct answer below.

Glencoe Algebra 1, Student Edition, 9780079039897, 0079039898, 2018
18th Edition
ISBN:9780079039897
Author:Carter
Publisher:Carter
Chapter10: Statistics
Section10.6: Summarizing Categorical Data
Problem 23PPS
icon
Related questions
icon
Concept explainers
Topic Video
Question
A survoy was conducted to determine the impact of contamination on property values. Home owners were randomly selected from each
of seven states-A, B, C, D, E, F, and G. Each homeowner was asked to estimate the property value of a home located in an area
contaminated by a certain substance. The dependent variable of interest was the substance discount percentage (the difference
between the current home value and the estimated value after contamination, as a percentage). The researchers were interested in
comparing the mean substance discount percentages across the seven states. Complete parts a and b.
a bac
the information provided to conduct the hypothesis test,
part a. Use a 0.05.
b. An ANOVA Summary table is shown to the right. Use
F-value p-value
Source
df
MS
States
Error
6 0.1136
68 0.8717 0.0128
0.199
0.0189
1.48
Total
74 0.9853
What is the rejection region? Select the correct choice below and fill in the answer box(es) to complete your choice.
(Round to two decimal places as needed.)
get O A. F>
B. F<
C. F< or F>
Identify the test statistic, F.
ee
F= (Round to two decimal places as needed.)
Identify the p-value.
(Round to three decimal places as needed.)
Determine the conclusion for the hypothesis test. Choose the correct answer below.
Transcribed Image Text:A survoy was conducted to determine the impact of contamination on property values. Home owners were randomly selected from each of seven states-A, B, C, D, E, F, and G. Each homeowner was asked to estimate the property value of a home located in an area contaminated by a certain substance. The dependent variable of interest was the substance discount percentage (the difference between the current home value and the estimated value after contamination, as a percentage). The researchers were interested in comparing the mean substance discount percentages across the seven states. Complete parts a and b. a bac the information provided to conduct the hypothesis test, part a. Use a 0.05. b. An ANOVA Summary table is shown to the right. Use F-value p-value Source df MS States Error 6 0.1136 68 0.8717 0.0128 0.199 0.0189 1.48 Total 74 0.9853 What is the rejection region? Select the correct choice below and fill in the answer box(es) to complete your choice. (Round to two decimal places as needed.) get O A. F> B. F< C. F< or F> Identify the test statistic, F. ee F= (Round to two decimal places as needed.) Identify the p-value. (Round to three decimal places as needed.) Determine the conclusion for the hypothesis test. Choose the correct answer below.
Expert Solution
trending now

Trending now

This is a popular solution!

steps

Step by step

Solved in 2 steps

Blurred answer
Knowledge Booster
Centre, Spread, and Shape of a Distribution
Learn more about
Need a deep-dive on the concept behind this application? Look no further. Learn more about this topic, statistics and related others by exploring similar questions and additional content below.
Recommended textbooks for you
Glencoe Algebra 1, Student Edition, 9780079039897…
Algebra
ISBN:
9780079039897
Author:
Carter
Publisher:
McGraw Hill