Have you ever opened a bag of M&Ms and been surprised at the distribution of colors? We are going to investigate the different colors of M&Ms in a bag!
Have you ever opened a bag of M&Ms and been surprised at the distribution of colors? We are going to investigate the different colors of M&Ms in a bag!

College Algebra
7th Edition
ISBN:9781305115545
Author:James Stewart, Lothar Redlin, Saleem Watson
Publisher:James Stewart, Lothar Redlin, Saleem Watson
Chapter9: Counting And Probability
Section9.3: Binomial Probability
Problem 2E: If a binomial experiment has probability p success, then the probability of failure is...

Related questions
Question
What’s the probability
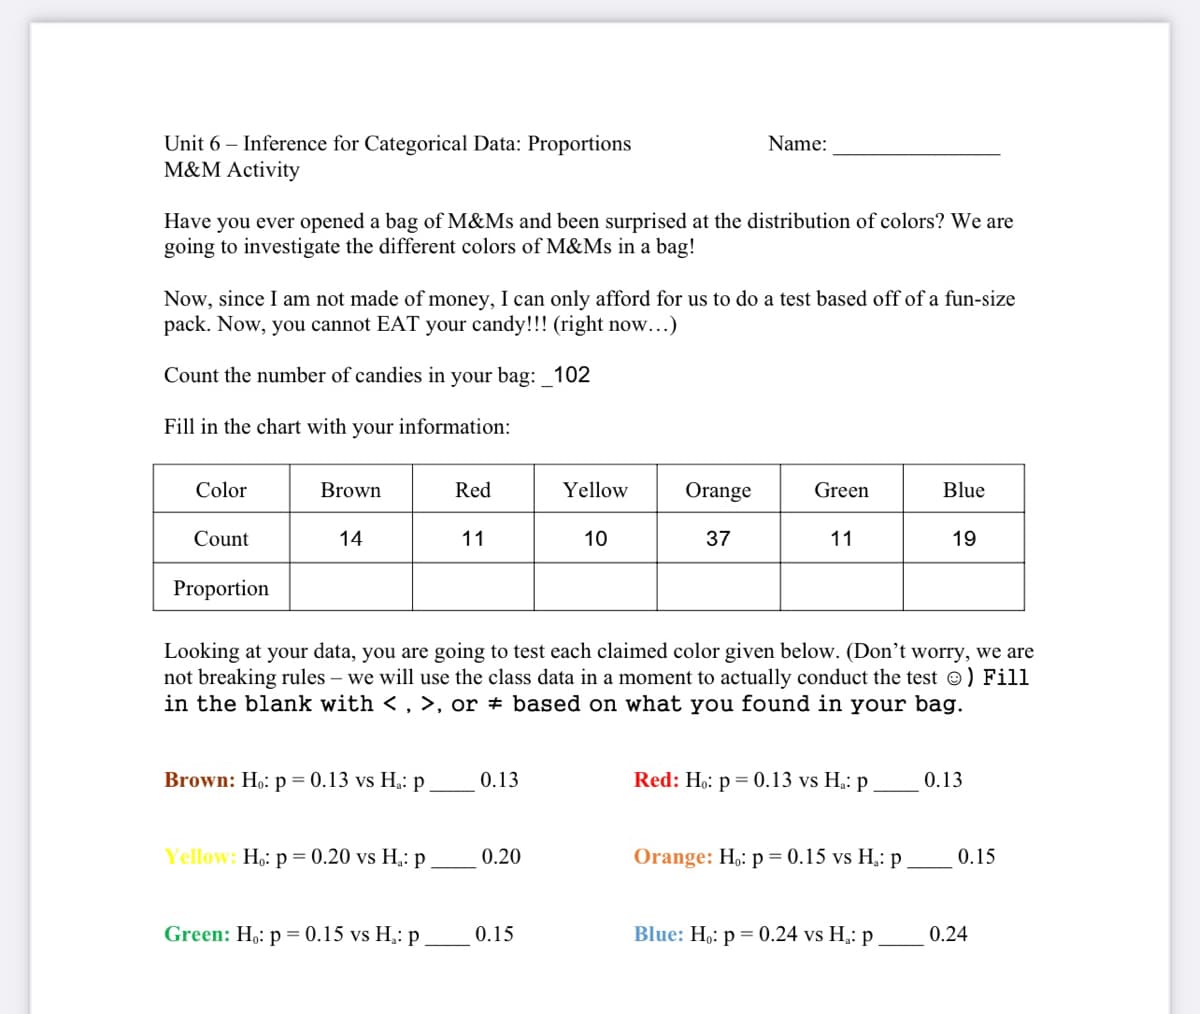
Transcribed Image Text:Unit 6 – Inference for Categorical Data: Proportions
M&M Activity
Name:
Have you ever opened a bag of M&Ms and been surprised at the distribution of colors? We are
going to investigate the different colors of M&Ms in a bag!
Now, since I am not made of money, I can only afford for us to do a test based off of a fun-size
pack. Now, you cannot EAT your candy!!! (right now...)
Count the number of candies in your bag: _102
Fill in the chart with your information:
Color
Brown
Red
Yellow
Orange
Green
Blue
Count
14
11
10
37
11
19
Proportion
Looking at your data, you are going to test each claimed color given below. (Don't worry, we are
not breaking rules – we will use the class data in a moment to actually conduct the test ©) Fill
in the blank with <, >, or # based on what you found in your bag.
Brown: Ho: p = 0.13 vs H,: p
0.13
Red: Ho: p = 0.13 vs H: p
0.13
Yellow: Ho: p = 0.20 vs H,: p
0.20
Orange: H,: p = 0.15 vs H,: p
0.15
Green: H,: p = 0.15 vs H,: p
0.15
Blue: H,: p = 0.24 vs H,: p
0.24
Expert Solution
This question has been solved!
Explore an expertly crafted, step-by-step solution for a thorough understanding of key concepts.

This is a popular solution!

Trending now
This is a popular solution!

Step by step
Solved in 2 steps

Recommended textbooks for you
College Algebra
Algebra
ISBN:
9781305115545
Author:
James Stewart, Lothar Redlin, Saleem Watson
Publisher:
Cengage Learning

Algebra & Trigonometry with Analytic Geometry
Algebra
ISBN:
9781133382119
Author:
Swokowski
Publisher:
Cengage
College Algebra
Algebra
ISBN:
9781305115545
Author:
James Stewart, Lothar Redlin, Saleem Watson
Publisher:
Cengage Learning
Algebra & Trigonometry with Analytic Geometry
Algebra
ISBN:
9781133382119
Author:
Swokowski
Publisher:
Cengage