A survey was conducted to determine the preferred number of children among 100 families. The results are shown below in a frequency distribution table. What is the mode of the data set? Number of Children 2 3 4 5 6 Frequency 25 20 15 12 10
A survey was conducted to determine the preferred number of children among 100 families. The results are shown below in a frequency distribution table. What is the mode of the data set? Number of Children 2 3 4 5 6 Frequency 25 20 15 12 10

Chapter9: Sequences, Probability And Counting Theory
Section9.7: Probability
Problem 4SE: What is the difference between events and outcomes? Give an example of both using the sample space...

Related questions
Question
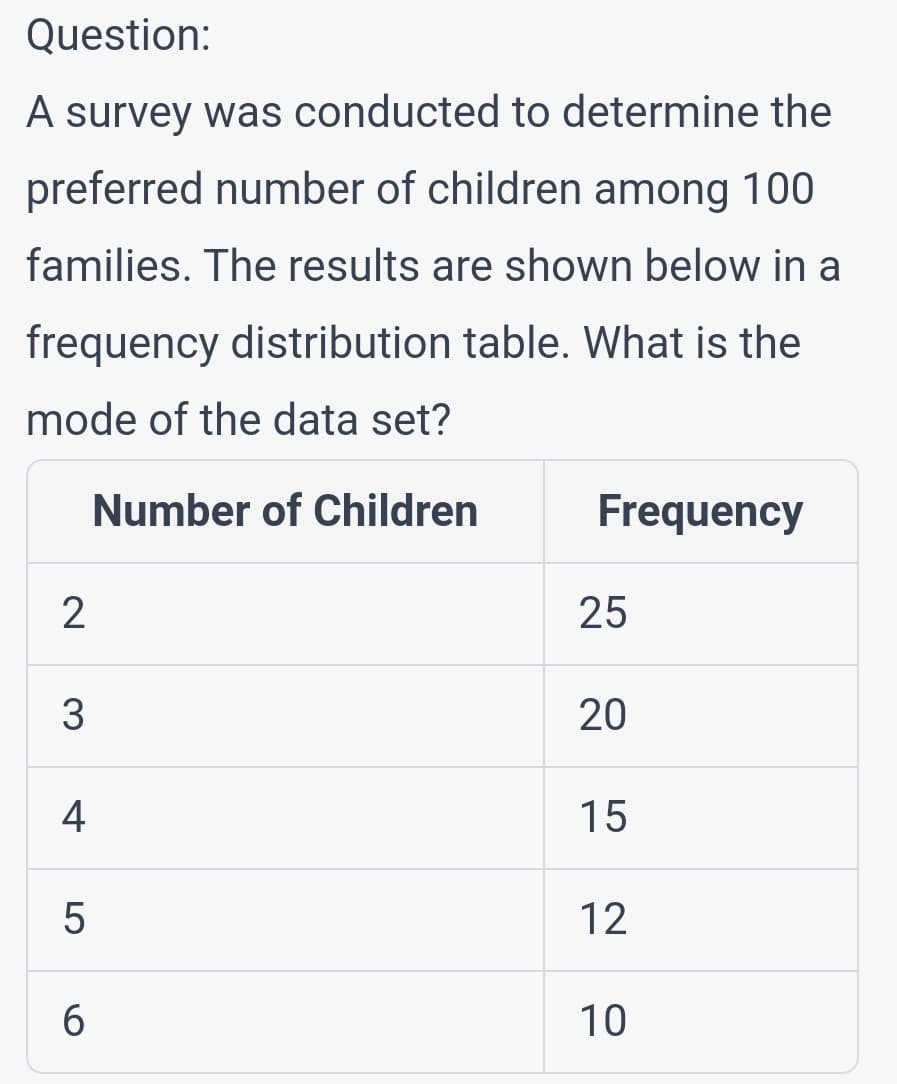
Transcribed Image Text:Question:
A survey was conducted to determine the
preferred number of children among 100
families. The results are shown below in a
frequency distribution table. What is the
mode of the data set?
Number of Children
2
3
4
LO
5
6
Frequency
25
20
15
12
10
Expert Solution
This question has been solved!
Explore an expertly crafted, step-by-step solution for a thorough understanding of key concepts.

Step by step
Solved in 2 steps

Recommended textbooks for you

College Algebra (MindTap Course List)
Algebra
ISBN:
9781305652231
Author:
R. David Gustafson, Jeff Hughes
Publisher:
Cengage Learning
College Algebra (MindTap Course List)
Algebra
ISBN:
9781305652231
Author:
R. David Gustafson, Jeff Hughes
Publisher:
Cengage Learning