A taxi company is trying to decide whether to purchase brand A or brand B tires for its fleet of taxis. To estimate the difference in the two brands, an experiment is conducted using 8 of each brand, assigned at random to the left and right rear wheels of 8 taxis. The tires are run until they wear out and the distances, in kilometers, are recorded in the accompanying data set. Find a 90% confidence interval for μ₁ - μ2. Assume that the differences of the distances are approximately normally distributed. Click here to view the data set. Click here to view page 1 of the table of critical values of the t-distribution. Click here to view page 2 of the table of critical values of the t-distribution. Let μ₁ be the population mean for brand A and let μ₂ be the population mean for brand B. The confidence interval is (Round to one decimal place as needed.) Critical Values of the t-Distribution Critical Values of the t-Distribution a a 0.40 0.30 0.20 0.15 0.10 0.05 0.025 0.02 0.015 0.01 0.0075 0.005 0.0025 0.0005 1 0.325 0.727 1.376 1.963 3.078 6.314 12.706 1 15.894 21.205 31.821 42.433 63.656 127.321 636.578 2 0.289 0.617 1.061 1.386 1.886 2.920 4.303 2 4.849 5.643 6.965 8.073 9.925 14.089 31.600 3 0.277 0.584 0.978 1.250 1.638 2.353 3.182 3 3.482 3.896 4.541 5.047 5.841 7.453 12.924 4 0.271 0.569 0.941 1.190 1.533 2.132 2.776 4 2.999 3.298 3.747 4.088 4.604 5.598 8.610 5 0.267 0.559 0.920 1.156 1.476 2.015 2.571 5 2.757 3.003 3.365 3.634 4.032 4.773 6.869 в 0.265 0.553 0.906 1.134 1.440 1.943 2.447 6 2.612 2.829 3.143 3.372 3.707 4.317 5.959 7 0.263 0.549 0.896 1.119 1.415 1.895 2.365 7 2.517 2.715 2.998 3.203 3.499 4.029 5.408 8 0.262 0.546 0.889 1.108 1.397 1.860 2.306 8 2.449 2.634 2.896 3.085 3.355 3.833 5.041 9 0.261 0.543 0.883 1.100 1.383 1.833 2.262 9 2.398 2.574 2.821 2.998 3.250 3.690 4.781 10 0.260 0.542 0.879 1.093 1.372 1.812 2.228 10 2.359 2.527 2.764 2.932 3.169 3.581 4.587 11 0.260 0.540 0.876 1.088 1.363 1.796 2.201 11 2.328 2.491 2.718 2.879 3.106 3.497 4.437 12 0.259 0.539 0.873 1.083 1.356 1.782 2.179 12 2.303 2.461 2.681 2.836 3.055 3.428 4.318 13 0.259 0.538 0.870 1.079 1.350 1.771 2.160 13 2.282 2.436 2.650 2.801 3.012 3.372 4.221 14 0.258 0.537 0.868 1.076 1.345 1.761 2.145 14 2.264 2.415 2.624 2.771 2.977 3.326 4.140 15 0.258 0.536 0.866 1.074 1.341 1.753 2.131 15 2.249 2.397 2.602 2.746 2.947 3.286 4.073 16 0.258 0.535 0.865 1.071 1.337 1.746 2.120 16 2.235 2.382 2.583 2.724 2.921 3.252 4.015 17 0.257 0.534 0.863 1.069 1.333 1.740 2.110 17 2.224 2.368 2.567 2.706 2.898 3.222 3.965 18 0.257 0.534 0.862 1.067 1.330 1.734 2.101 18 2.214 2.356 2.552 2.689 2.878 3.197 3.922 19 0.257 0.533 0.861 1.066 1.328 1.729 2.093 2.205 2.346 2.539 2.674 2.861 3.174 3.883 20 0.257 0.533 0.860 1.064 1.325 1.725 2.086 20 2.197 2.336 2.528 2.661 2.845 3.153 3.850 21 0.257 0.532 0.859 1.063 1.323 1.721 2.080 21 2.189 2.328 2.518 2.649 2.831 3.135 3.819 22 0.256 0.532 0.858 1.061 1.321 1.717 2.074 22 2.183 2.320 2.508 2.639 2.819 3.119 3.792 23 0.256 0.532 0.858 1.060 1.319 1.714 2.069 23 2.177 2.313 2.500 2.629 2.807 3.104 3.768 24 0.256 0.531 0.857 1.059 1.318 1.711 2.064 24 2.172 2.307 2.492 2.620 2.797 3.091 3.745 25 0.256 0.531 0.856 1.058 1.316 1.708 2.060 25 2.167 2.301 2.485 2.612 2.787 3.078 3.725 26 0.256 0.531 0.856 1.058 1.315 1.706 2.056 27 0.256 0.531 0.855 1.057 1.314 1.703 2.052 28 0.256 0.530 0.855 1.056 1.313 1.701 2.048 - 29 0.256 0.530 0.854 1.055 1.311 1.699 2.045 30 0.256 0.530 0.854 1.055 1.310 1.697 2.042 40 0.255 0.529 0.851 1.050 1.303 1.684 2.021 60 0.254 0.527 0.848 1.045 1.296 1.671 2.000 120 0.254 0.526 0.845 1.041 1.289 1.658 1.980 8" 0.253 0.524 0.842 1.036 1.282 1.645 1.960 e 0.40 0.30 0.20 0.15 0.10 - <> 120 888 988 26 2.162 2.296 2.479 2.605 2.779 3.067 3.707 27 2.158 2.291 2.473 2.598 2.771 3.057 3.689 28 2.154 2.286 2.467 2.592 2.763 3.047 3.674 2.150 2.282 2.462 2.586 2.756 3.038 3.660 30 2.147 2.278 2.457 2.581 2.750 3.030 3.646 40 2.123 2.250 2.423 2.542 2.704 2.971 3.551 60 2.099 2.223 2.390 2.504 2.660 2.915 3.460 2.076 2.196 2.358 2.468 2.617 2.860 3.373 2.054 2.170 2.326 2.432 2.576 2.807 3.290 0.05 0.025 0.02 0.015 0.01 0.0075 0.005 0.0025 0.0005 a A a C
A taxi company is trying to decide whether to purchase brand A or brand B tires for its fleet of taxis. To estimate the difference in the two brands, an experiment is conducted using 8 of each brand, assigned at random to the left and right rear wheels of 8 taxis. The tires are run until they wear out and the distances, in kilometers, are recorded in the accompanying data set. Find a 90% confidence interval for μ₁ - μ2. Assume that the differences of the distances are approximately normally distributed. Click here to view the data set. Click here to view page 1 of the table of critical values of the t-distribution. Click here to view page 2 of the table of critical values of the t-distribution. Let μ₁ be the population mean for brand A and let μ₂ be the population mean for brand B. The confidence interval is (Round to one decimal place as needed.) Critical Values of the t-Distribution Critical Values of the t-Distribution a a 0.40 0.30 0.20 0.15 0.10 0.05 0.025 0.02 0.015 0.01 0.0075 0.005 0.0025 0.0005 1 0.325 0.727 1.376 1.963 3.078 6.314 12.706 1 15.894 21.205 31.821 42.433 63.656 127.321 636.578 2 0.289 0.617 1.061 1.386 1.886 2.920 4.303 2 4.849 5.643 6.965 8.073 9.925 14.089 31.600 3 0.277 0.584 0.978 1.250 1.638 2.353 3.182 3 3.482 3.896 4.541 5.047 5.841 7.453 12.924 4 0.271 0.569 0.941 1.190 1.533 2.132 2.776 4 2.999 3.298 3.747 4.088 4.604 5.598 8.610 5 0.267 0.559 0.920 1.156 1.476 2.015 2.571 5 2.757 3.003 3.365 3.634 4.032 4.773 6.869 в 0.265 0.553 0.906 1.134 1.440 1.943 2.447 6 2.612 2.829 3.143 3.372 3.707 4.317 5.959 7 0.263 0.549 0.896 1.119 1.415 1.895 2.365 7 2.517 2.715 2.998 3.203 3.499 4.029 5.408 8 0.262 0.546 0.889 1.108 1.397 1.860 2.306 8 2.449 2.634 2.896 3.085 3.355 3.833 5.041 9 0.261 0.543 0.883 1.100 1.383 1.833 2.262 9 2.398 2.574 2.821 2.998 3.250 3.690 4.781 10 0.260 0.542 0.879 1.093 1.372 1.812 2.228 10 2.359 2.527 2.764 2.932 3.169 3.581 4.587 11 0.260 0.540 0.876 1.088 1.363 1.796 2.201 11 2.328 2.491 2.718 2.879 3.106 3.497 4.437 12 0.259 0.539 0.873 1.083 1.356 1.782 2.179 12 2.303 2.461 2.681 2.836 3.055 3.428 4.318 13 0.259 0.538 0.870 1.079 1.350 1.771 2.160 13 2.282 2.436 2.650 2.801 3.012 3.372 4.221 14 0.258 0.537 0.868 1.076 1.345 1.761 2.145 14 2.264 2.415 2.624 2.771 2.977 3.326 4.140 15 0.258 0.536 0.866 1.074 1.341 1.753 2.131 15 2.249 2.397 2.602 2.746 2.947 3.286 4.073 16 0.258 0.535 0.865 1.071 1.337 1.746 2.120 16 2.235 2.382 2.583 2.724 2.921 3.252 4.015 17 0.257 0.534 0.863 1.069 1.333 1.740 2.110 17 2.224 2.368 2.567 2.706 2.898 3.222 3.965 18 0.257 0.534 0.862 1.067 1.330 1.734 2.101 18 2.214 2.356 2.552 2.689 2.878 3.197 3.922 19 0.257 0.533 0.861 1.066 1.328 1.729 2.093 2.205 2.346 2.539 2.674 2.861 3.174 3.883 20 0.257 0.533 0.860 1.064 1.325 1.725 2.086 20 2.197 2.336 2.528 2.661 2.845 3.153 3.850 21 0.257 0.532 0.859 1.063 1.323 1.721 2.080 21 2.189 2.328 2.518 2.649 2.831 3.135 3.819 22 0.256 0.532 0.858 1.061 1.321 1.717 2.074 22 2.183 2.320 2.508 2.639 2.819 3.119 3.792 23 0.256 0.532 0.858 1.060 1.319 1.714 2.069 23 2.177 2.313 2.500 2.629 2.807 3.104 3.768 24 0.256 0.531 0.857 1.059 1.318 1.711 2.064 24 2.172 2.307 2.492 2.620 2.797 3.091 3.745 25 0.256 0.531 0.856 1.058 1.316 1.708 2.060 25 2.167 2.301 2.485 2.612 2.787 3.078 3.725 26 0.256 0.531 0.856 1.058 1.315 1.706 2.056 27 0.256 0.531 0.855 1.057 1.314 1.703 2.052 28 0.256 0.530 0.855 1.056 1.313 1.701 2.048 - 29 0.256 0.530 0.854 1.055 1.311 1.699 2.045 30 0.256 0.530 0.854 1.055 1.310 1.697 2.042 40 0.255 0.529 0.851 1.050 1.303 1.684 2.021 60 0.254 0.527 0.848 1.045 1.296 1.671 2.000 120 0.254 0.526 0.845 1.041 1.289 1.658 1.980 8" 0.253 0.524 0.842 1.036 1.282 1.645 1.960 e 0.40 0.30 0.20 0.15 0.10 - <> 120 888 988 26 2.162 2.296 2.479 2.605 2.779 3.067 3.707 27 2.158 2.291 2.473 2.598 2.771 3.057 3.689 28 2.154 2.286 2.467 2.592 2.763 3.047 3.674 2.150 2.282 2.462 2.586 2.756 3.038 3.660 30 2.147 2.278 2.457 2.581 2.750 3.030 3.646 40 2.123 2.250 2.423 2.542 2.704 2.971 3.551 60 2.099 2.223 2.390 2.504 2.660 2.915 3.460 2.076 2.196 2.358 2.468 2.617 2.860 3.373 2.054 2.170 2.326 2.432 2.576 2.807 3.290 0.05 0.025 0.02 0.015 0.01 0.0075 0.005 0.0025 0.0005 a A a C

Advanced Engineering Mathematics
10th Edition
ISBN:9780470458365
Author:Erwin Kreyszig
Publisher:Erwin Kreyszig
Chapter2: Second-order Linear Odes
Section: Chapter Questions
Problem 1RQ
Question
Taxi Brand A Brand B
1 41,200 42,700
2 31,100 31,200
3 43,600 44,600
4 42,600 40,900
5 41,400 41,100
6 35,600 40,200
7 47,000 48,200
8 40,200 41,400
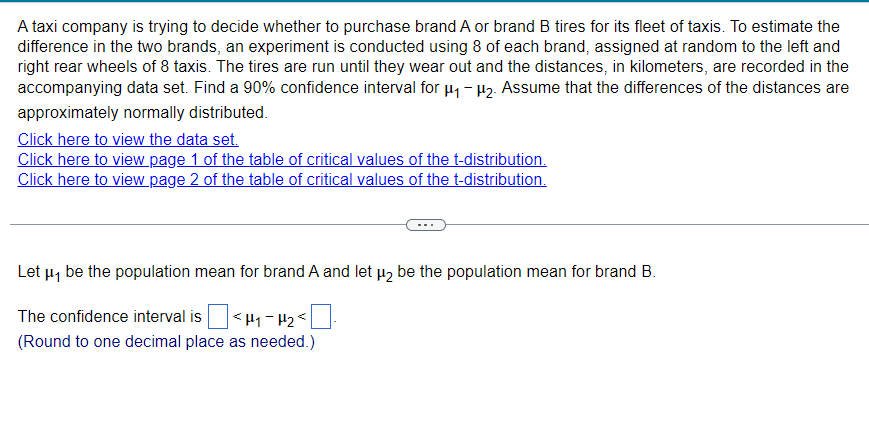
Transcribed Image Text:A taxi company is trying to decide whether to purchase brand A or brand B tires for its fleet of taxis. To estimate the
difference in the two brands, an experiment is conducted using 8 of each brand, assigned at random to the left and
right rear wheels of 8 taxis. The tires are run until they wear out and the distances, in kilometers, are recorded in the
accompanying data set. Find a 90% confidence interval for μ₁ - μ2. Assume that the differences of the distances are
approximately normally distributed.
Click here to view the data set.
Click here to view page 1 of the table of critical values of the t-distribution.
Click here to view page 2 of the table of critical values of the t-distribution.
Let μ₁ be the population mean for brand A and let μ₂ be the population mean for brand B.
The confidence interval is
(Round to one decimal place as needed.)
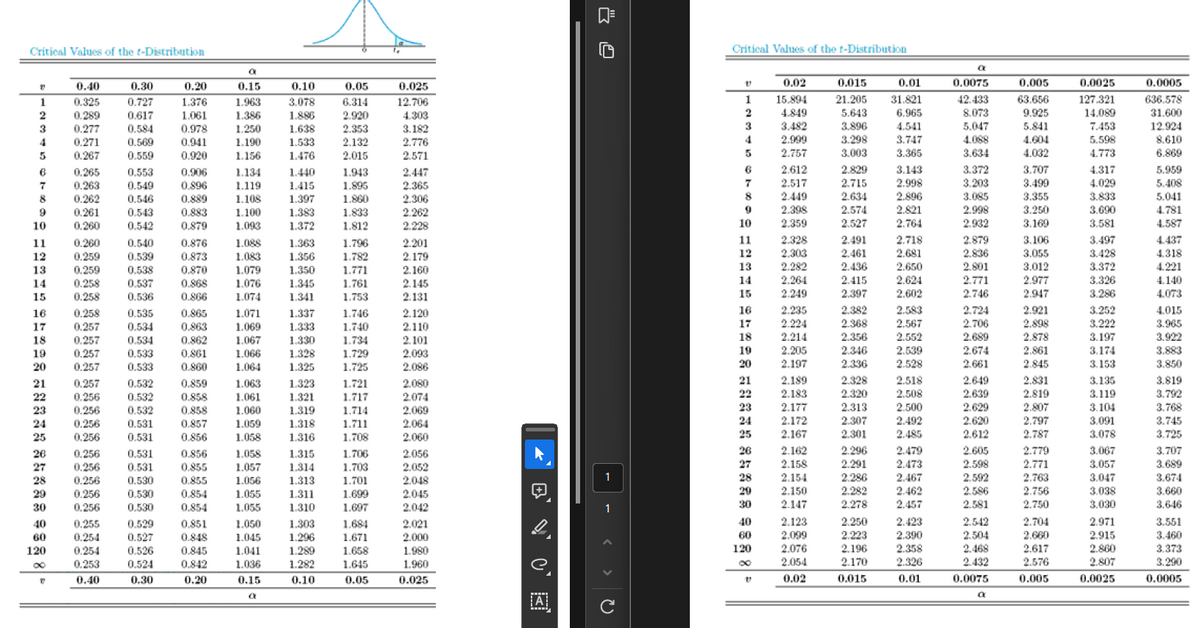
Transcribed Image Text:Critical Values of the t-Distribution
Critical Values of the t-Distribution
a
a
0.40
0.30
0.20
0.15
0.10
0.05
0.025
0.02
0.015
0.01
0.0075
0.005
0.0025
0.0005
1
0.325
0.727
1.376
1.963
3.078
6.314
12.706
1
15.894
21.205
31.821
42.433
63.656
127.321
636.578
2
0.289
0.617
1.061
1.386
1.886
2.920
4.303
2
4.849
5.643
6.965
8.073
9.925
14.089
31.600
3
0.277
0.584
0.978
1.250
1.638
2.353
3.182
3
3.482
3.896
4.541
5.047
5.841
7.453
12.924
4
0.271
0.569
0.941
1.190
1.533
2.132
2.776
4
2.999
3.298
3.747
4.088
4.604
5.598
8.610
5
0.267
0.559
0.920
1.156
1.476
2.015
2.571
5
2.757
3.003
3.365
3.634
4.032
4.773
6.869
в
0.265
0.553
0.906
1.134
1.440
1.943
2.447
6
2.612
2.829
3.143
3.372
3.707
4.317
5.959
7
0.263
0.549
0.896
1.119
1.415
1.895
2.365
7
2.517
2.715
2.998
3.203
3.499
4.029
5.408
8
0.262
0.546
0.889
1.108
1.397
1.860
2.306
8
2.449
2.634
2.896
3.085
3.355
3.833
5.041
9
0.261
0.543
0.883
1.100
1.383
1.833
2.262
9
2.398
2.574
2.821
2.998
3.250
3.690
4.781
10
0.260
0.542
0.879
1.093
1.372
1.812
2.228
10
2.359
2.527
2.764
2.932
3.169
3.581
4.587
11
0.260
0.540
0.876
1.088
1.363
1.796
2.201
11
2.328
2.491
2.718
2.879
3.106
3.497
4.437
12
0.259
0.539
0.873
1.083
1.356
1.782
2.179
12
2.303
2.461
2.681
2.836
3.055
3.428
4.318
13
0.259
0.538
0.870
1.079
1.350
1.771
2.160
13
2.282
2.436
2.650
2.801
3.012
3.372
4.221
14
0.258
0.537
0.868
1.076
1.345
1.761
2.145
14
2.264
2.415
2.624
2.771
2.977
3.326
4.140
15
0.258
0.536
0.866
1.074
1.341
1.753
2.131
15
2.249
2.397
2.602
2.746
2.947
3.286
4.073
16
0.258
0.535
0.865
1.071
1.337
1.746
2.120
16
2.235
2.382
2.583
2.724
2.921
3.252
4.015
17
0.257
0.534
0.863
1.069
1.333
1.740
2.110
17
2.224
2.368
2.567
2.706
2.898
3.222
3.965
18
0.257
0.534
0.862
1.067
1.330
1.734
2.101
18
2.214
2.356
2.552
2.689
2.878
3.197
3.922
19
0.257
0.533
0.861
1.066
1.328
1.729
2.093
2.205
2.346
2.539
2.674
2.861
3.174
3.883
20
0.257
0.533
0.860
1.064
1.325
1.725
2.086
20
2.197
2.336
2.528
2.661
2.845
3.153
3.850
21
0.257
0.532
0.859
1.063
1.323
1.721
2.080
21
2.189
2.328
2.518
2.649
2.831
3.135
3.819
22
0.256
0.532
0.858
1.061
1.321
1.717
2.074
22
2.183
2.320
2.508
2.639
2.819
3.119
3.792
23
0.256
0.532
0.858
1.060
1.319
1.714
2.069
23
2.177
2.313
2.500
2.629
2.807
3.104
3.768
24
0.256
0.531
0.857
1.059
1.318
1.711
2.064
24
2.172
2.307
2.492
2.620
2.797
3.091
3.745
25
0.256
0.531
0.856
1.058
1.316
1.708
2.060
25
2.167
2.301
2.485
2.612
2.787
3.078
3.725
26
0.256
0.531
0.856
1.058
1.315
1.706
2.056
27
0.256
0.531
0.855
1.057
1.314
1.703
2.052
28
0.256
0.530
0.855
1.056
1.313
1.701
2.048
-
29
0.256
0.530
0.854
1.055
1.311
1.699
2.045
30
0.256
0.530
0.854
1.055
1.310
1.697
2.042
40
0.255
0.529
0.851
1.050
1.303
1.684
2.021
60
0.254
0.527
0.848
1.045
1.296
1.671
2.000
120
0.254
0.526
0.845
1.041
1.289
1.658
1.980
8"
0.253
0.524
0.842
1.036
1.282
1.645
1.960
e
0.40
0.30
0.20
0.15
0.10
- <>
120
888 988
26
2.162
2.296
2.479
2.605
2.779
3.067
3.707
27
2.158
2.291
2.473
2.598
2.771
3.057
3.689
28
2.154
2.286
2.467
2.592
2.763
3.047
3.674
2.150
2.282
2.462
2.586
2.756
3.038
3.660
30
2.147
2.278
2.457
2.581
2.750
3.030
3.646
40
2.123
2.250
2.423
2.542
2.704
2.971
3.551
60
2.099
2.223
2.390
2.504
2.660
2.915
3.460
2.076
2.196
2.358
2.468
2.617
2.860
3.373
2.054
2.170
2.326
2.432
2.576
2.807
3.290
0.05
0.025
0.02
0.015
0.01
0.0075
0.005
0.0025
0.0005
a
A
a
C
AI-Generated Solution

Unlock instant AI solutions
Tap the button
to generate a solution
Recommended textbooks for you
Advanced Engineering Mathematics
Advanced Math
ISBN:
9780470458365
Author:
Erwin Kreyszig
Publisher:
Wiley, John & Sons, Incorporated

Numerical Methods for Engineers
Advanced Math
ISBN:
9780073397924
Author:
Steven C. Chapra Dr., Raymond P. Canale
Publisher:
McGraw-Hill Education

Introductory Mathematics for Engineering Applicat…
Advanced Math
ISBN:
9781118141809
Author:
Nathan Klingbeil
Publisher:
WILEY
Advanced Engineering Mathematics
Advanced Math
ISBN:
9780470458365
Author:
Erwin Kreyszig
Publisher:
Wiley, John & Sons, Incorporated
Numerical Methods for Engineers
Advanced Math
ISBN:
9780073397924
Author:
Steven C. Chapra Dr., Raymond P. Canale
Publisher:
McGraw-Hill Education
Introductory Mathematics for Engineering Applicat…
Advanced Math
ISBN:
9781118141809
Author:
Nathan Klingbeil
Publisher:
WILEY

Mathematics For Machine Technology
Advanced Math
ISBN:
9781337798310
Author:
Peterson, John.
Publisher:
Cengage Learning,

