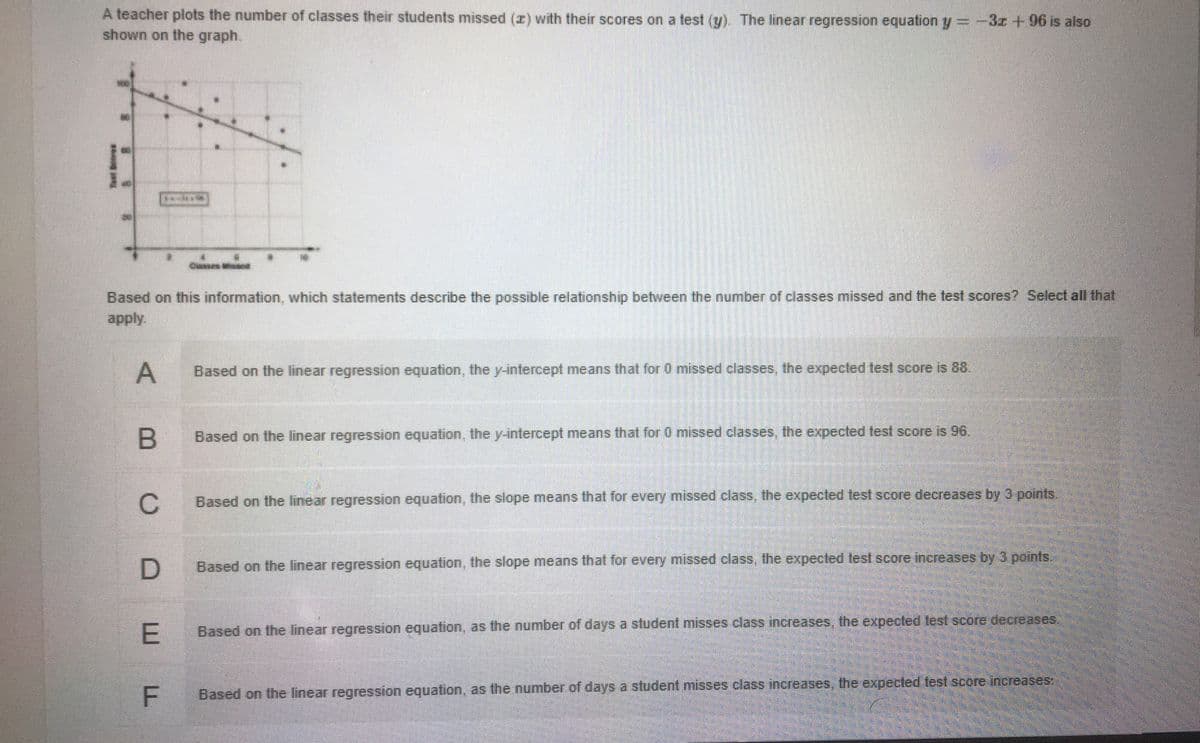
A teacher plots the number of classes their students missed (z) with their scores on a test (y). The linear regression equation y = -3z + 96 is also shown on the graph. Based on this information, which statements describe the possible relationship between the number of classes missed and the test scores? Select all that apply. A Based on the linear regression equation, the y-intercept means that for 0 missed classes, the expected test score is 88. Based on the linear regression equation, the y-intercept means that for 0 missed classes, the expected test score is 96. Based on the linear regression equation, the slope means that for every missed class, the expected test score decreases by 3 points. Based on the linear regression equation, the slope means that for every missed class, the expected test score increases by 3 points. E Based on the linear regression equation, as the number of days a student misses class increases, the expected test score decreases, Based on the linear regression equation, as the number of days a student misses class increases, the expected test score increases: F.


Correlation
Correlation defines a relationship between two independent variables. It tells the degree to which variables move in relation to each other. When two sets of data are related to each other, there is a correlation between them.
Linear Correlation
A correlation is used to determine the relationships between numerical and categorical variables. In other words, it is an indicator of how things are connected to one another. The correlation analysis is the study of how variables are related.
Regression Analysis
Regression analysis is a statistical method in which it estimates the relationship between a dependent variable and one or more independent variable. In simple terms dependent variable is called as outcome variable and independent variable is called as predictors. Regression analysis is one of the methods to find the trends in data. The independent variable used in Regression analysis is named Predictor variable. It offers data of an associated dependent variable regarding a particular outcome.


Trending now
This is a popular solution!

Step by step
Solved in 2 steps


