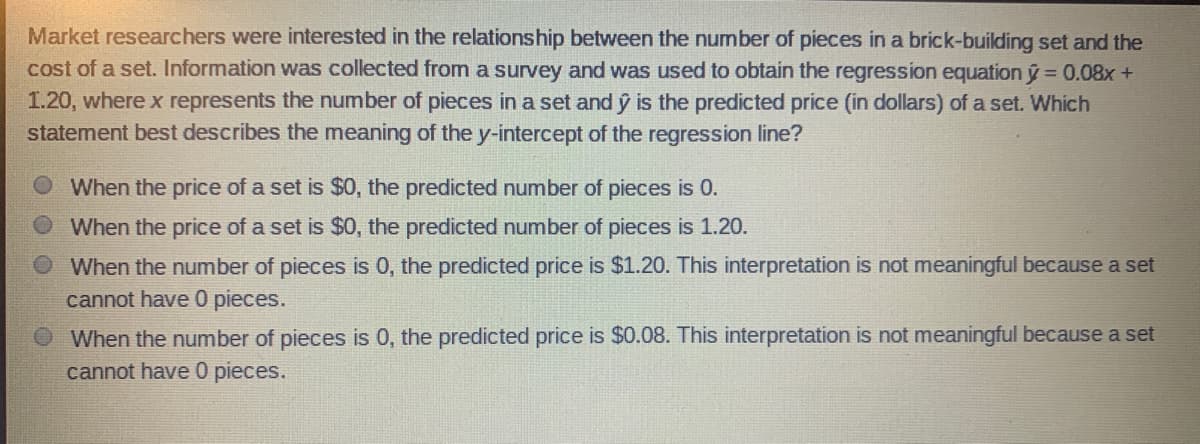
Market researchers were interested in the relationship between the number of pieces in a brick-building set and the cost of a set. Information was collected from a survey and was used to obtain the regression equation y= 0.08x + 1.20, where x represents the number of pieces in a set and ŷ is the predicted price (in dollars) of a set. Which statement best describes the meaning of the y-intercept of the regression line? When the price of a set is $0, the predicted number of pieces is 0. When the price of a set is $0, the predicted number of pieces is 1.20. When the number of pieces is 0, the predicted price is $1.20. This interpretation is not meaningful because a set cannot have 0 pieces. O When the number of pieces is 0, the predicted price is $0.08. This interpretation is not meaningful because a set cannot have 0 pieces.


Correlation
Correlation defines a relationship between two independent variables. It tells the degree to which variables move in relation to each other. When two sets of data are related to each other, there is a correlation between them.
Linear Correlation
A correlation is used to determine the relationships between numerical and categorical variables. In other words, it is an indicator of how things are connected to one another. The correlation analysis is the study of how variables are related.
Regression Analysis
Regression analysis is a statistical method in which it estimates the relationship between a dependent variable and one or more independent variable. In simple terms dependent variable is called as outcome variable and independent variable is called as predictors. Regression analysis is one of the methods to find the trends in data. The independent variable used in Regression analysis is named Predictor variable. It offers data of an associated dependent variable regarding a particular outcome.


Trending now
This is a popular solution!

Step by step
Solved in 2 steps


