A traffic safety company publishes reports about motorcycle fatalities and helmet use. In the first accompanying data table, the distribution shows the proportion of fatalities by locati of injury for motorcycle accidents. The second data table shows the location of injury and fatalities for 2061 riders not wearing a helmet. Complete parts (a) and (b) below. Click the icon to view the tables. Click the icon to view the chi-square table of critical values. (a) Does the distribution of fatal injuries for riders not wearing a helmet follow the distribution for all riders? Use a = 0.10 level of significance. What are the null and alternative hypotheses? Ho The distribution of fatal injuries for riders not wearing a helmet follows the same distribution for all other riders. H₁: The distribution of fatal injuries for riders not wearing a helmet does not follow the same distribution for all other riders. Compute the expected counts for each fatal injury Observed Count Location of injury Multiple Locations 1029 854 38 Thorax 90 Abdomen/Lumbar/Spine 50 (Round to two decimal places as needed.) an example Head Neck Get more help - Search Expected Count Distribution of fatalities by location of injury Proportion of fatalities by location of injury for motorcycle accidents Multiple Neck Thorax 0.060 Head locations 0.570 0.310 0.030 Location of injury Proportion Location of injury and fatalities for 2061 riders not wearing a helmet Multiple locations Head Neck Thorax 90 1029 854 38 Location of injury Number D Abdomen/ Lumbar/ Spi 0.030 Abdomen/ Lumbar/ Spi 50 1:14 PM 11/28/2022
A traffic safety company publishes reports about motorcycle fatalities and helmet use. In the first accompanying data table, the distribution shows the proportion of fatalities by locati of injury for motorcycle accidents. The second data table shows the location of injury and fatalities for 2061 riders not wearing a helmet. Complete parts (a) and (b) below. Click the icon to view the tables. Click the icon to view the chi-square table of critical values. (a) Does the distribution of fatal injuries for riders not wearing a helmet follow the distribution for all riders? Use a = 0.10 level of significance. What are the null and alternative hypotheses? Ho The distribution of fatal injuries for riders not wearing a helmet follows the same distribution for all other riders. H₁: The distribution of fatal injuries for riders not wearing a helmet does not follow the same distribution for all other riders. Compute the expected counts for each fatal injury Observed Count Location of injury Multiple Locations 1029 854 38 Thorax 90 Abdomen/Lumbar/Spine 50 (Round to two decimal places as needed.) an example Head Neck Get more help - Search Expected Count Distribution of fatalities by location of injury Proportion of fatalities by location of injury for motorcycle accidents Multiple Neck Thorax 0.060 Head locations 0.570 0.310 0.030 Location of injury Proportion Location of injury and fatalities for 2061 riders not wearing a helmet Multiple locations Head Neck Thorax 90 1029 854 38 Location of injury Number D Abdomen/ Lumbar/ Spi 0.030 Abdomen/ Lumbar/ Spi 50 1:14 PM 11/28/2022

Glencoe Algebra 1, Student Edition, 9780079039897, 0079039898, 2018
18th Edition
ISBN:9780079039897
Author:Carter
Publisher:Carter
Chapter10: Statistics
Section10.4: Distributions Of Data
Problem 22PFA

Related questions
Question
100%
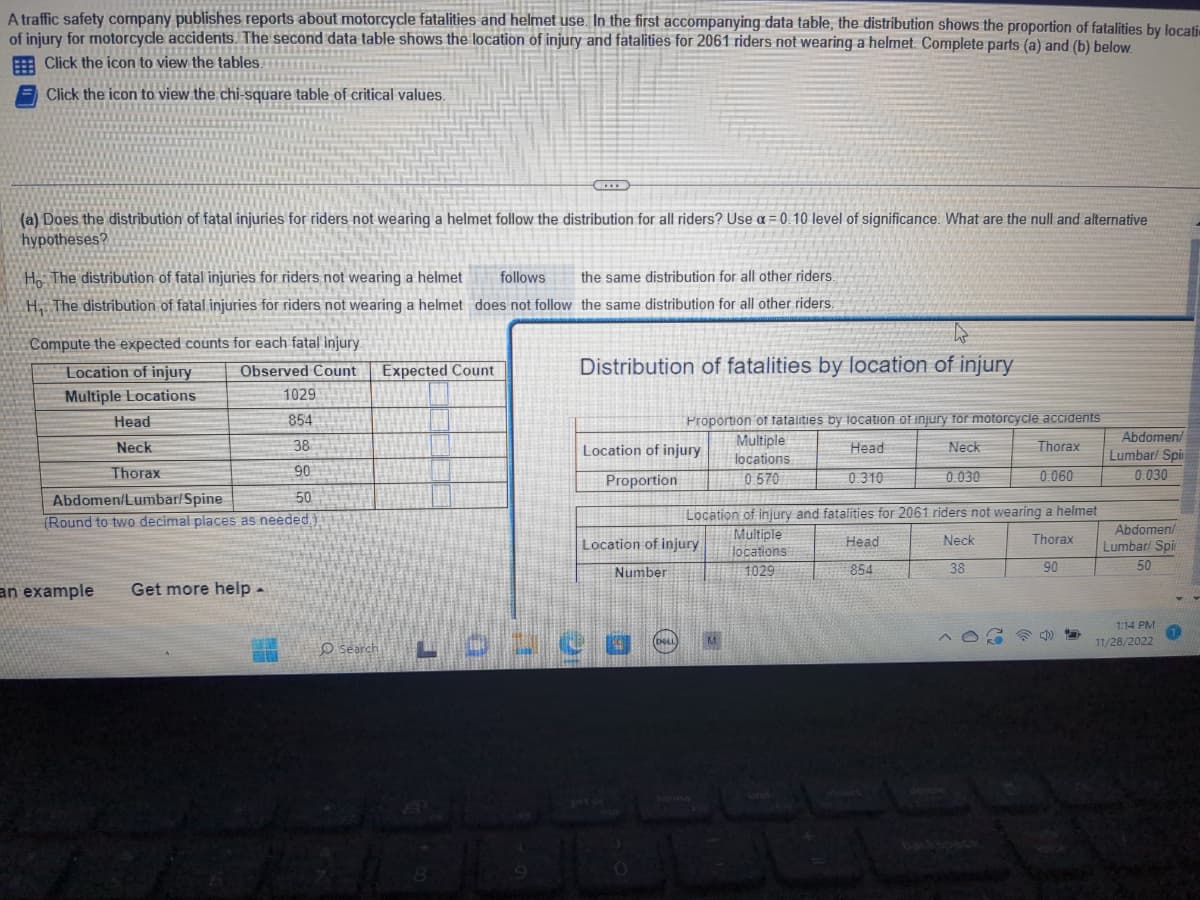
Transcribed Image Text:A traffic safety company publishes reports about motorcycle fatalities and helmet use. In the first accompanying data table, the distribution shows the proportion of fatalities by locati
of injury for motorcycle accidents. The second data table shows the location of injury and fatalities for 2061 riders not wearing a helmet. Complete parts (a) and (b) below.
Click the icon to view the tables.
Click the icon to view the chi-square table of critical values.
(a) Does the distribution of fatal injuries for riders not wearing a helmet follow the distribution for all riders? Use a = 0.10 level of significance. What are the null and alternative
hypotheses?
Ho The distribution of fatal injuries for riders not wearing a helmet follows the same distribution for all other riders.
H₁: The distribution of fatal injuries for riders not wearing a helmet does not follow the same distribution for all other riders.
Compute the expected counts for each fatal injury
Observed Count
Location of injury
Multiple Locations
1029
854
38
Thorax
90
Abdomen/Lumbar/Spine
50
(Round to two decimal places as needed.)
an example
Head
Neck
Get more help -
Search
Expected Count
Distribution of fatalities by location of injury
Proportion of fatalities by location of injury for motorcycle accidents
Multiple
Head
Neck
Thorax
0.060
locations
0.570
0.310
0.030
Location of injury
Proportion
Location of injury and fatalities for 2061 riders not wearing a helmet
Multiple
locations
Head
Neck
Thorax
90
1029
854
38
Location of injury
Number
2
Abdomen/
Lumbar/ Spi
0.030
Abdomen/
Lumbar/ Spi
50
1:14 PM
11/28/2022
Expert Solution
This question has been solved!
Explore an expertly crafted, step-by-step solution for a thorough understanding of key concepts.

Step by step
Solved in 2 steps

Recommended textbooks for you
Glencoe Algebra 1, Student Edition, 9780079039897…
Algebra
ISBN:
9780079039897
Author:
Carter
Publisher:
McGraw Hill

College Algebra (MindTap Course List)
Algebra
ISBN:
9781305652231
Author:
R. David Gustafson, Jeff Hughes
Publisher:
Cengage Learning

Big Ideas Math A Bridge To Success Algebra 1: Stu…
Algebra
ISBN:
9781680331141
Author:
HOUGHTON MIFFLIN HARCOURT
Publisher:
Houghton Mifflin Harcourt
Glencoe Algebra 1, Student Edition, 9780079039897…
Algebra
ISBN:
9780079039897
Author:
Carter
Publisher:
McGraw Hill
College Algebra (MindTap Course List)
Algebra
ISBN:
9781305652231
Author:
R. David Gustafson, Jeff Hughes
Publisher:
Cengage Learning
Big Ideas Math A Bridge To Success Algebra 1: Stu…
Algebra
ISBN:
9781680331141
Author:
HOUGHTON MIFFLIN HARCOURT
Publisher:
Houghton Mifflin Harcourt

Holt Mcdougal Larson Pre-algebra: Student Edition…
Algebra
ISBN:
9780547587776
Author:
HOLT MCDOUGAL
Publisher:
HOLT MCDOUGAL