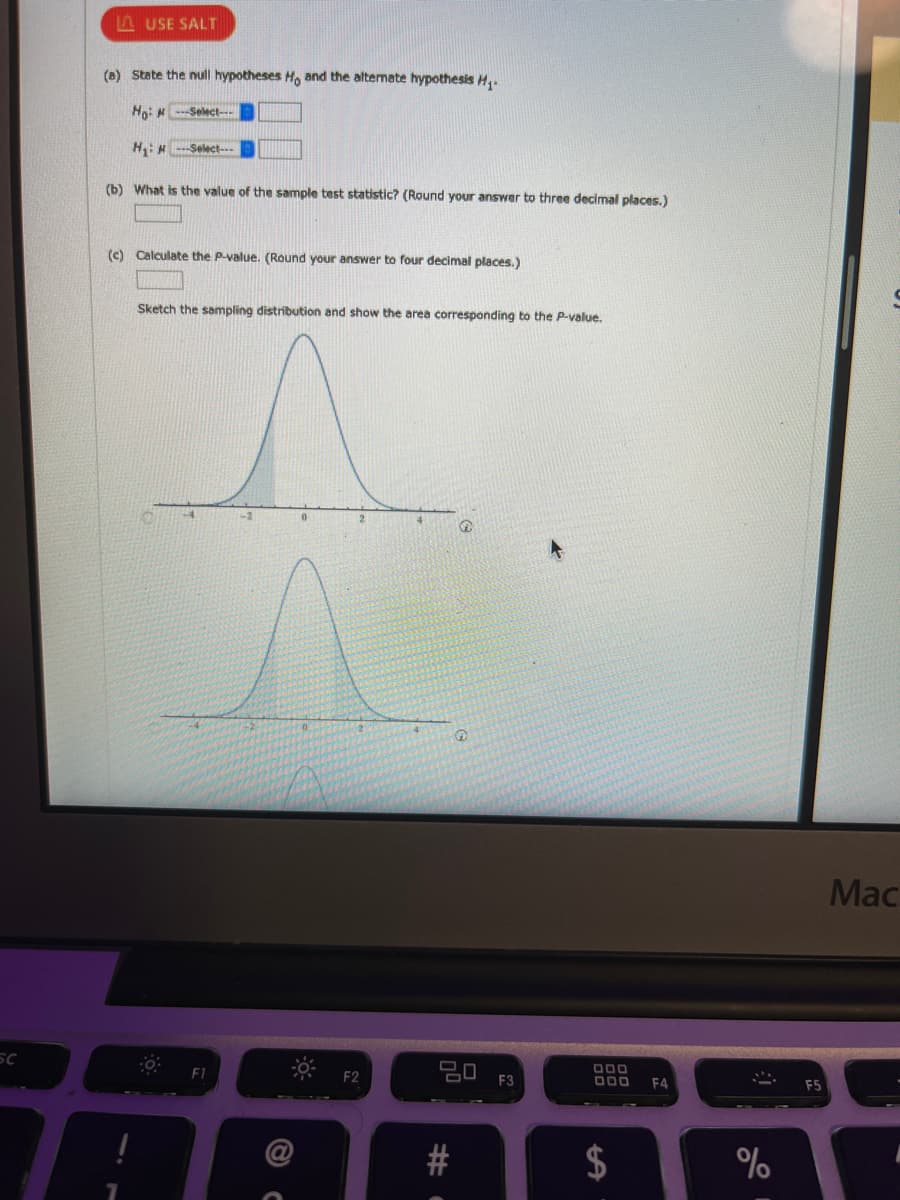
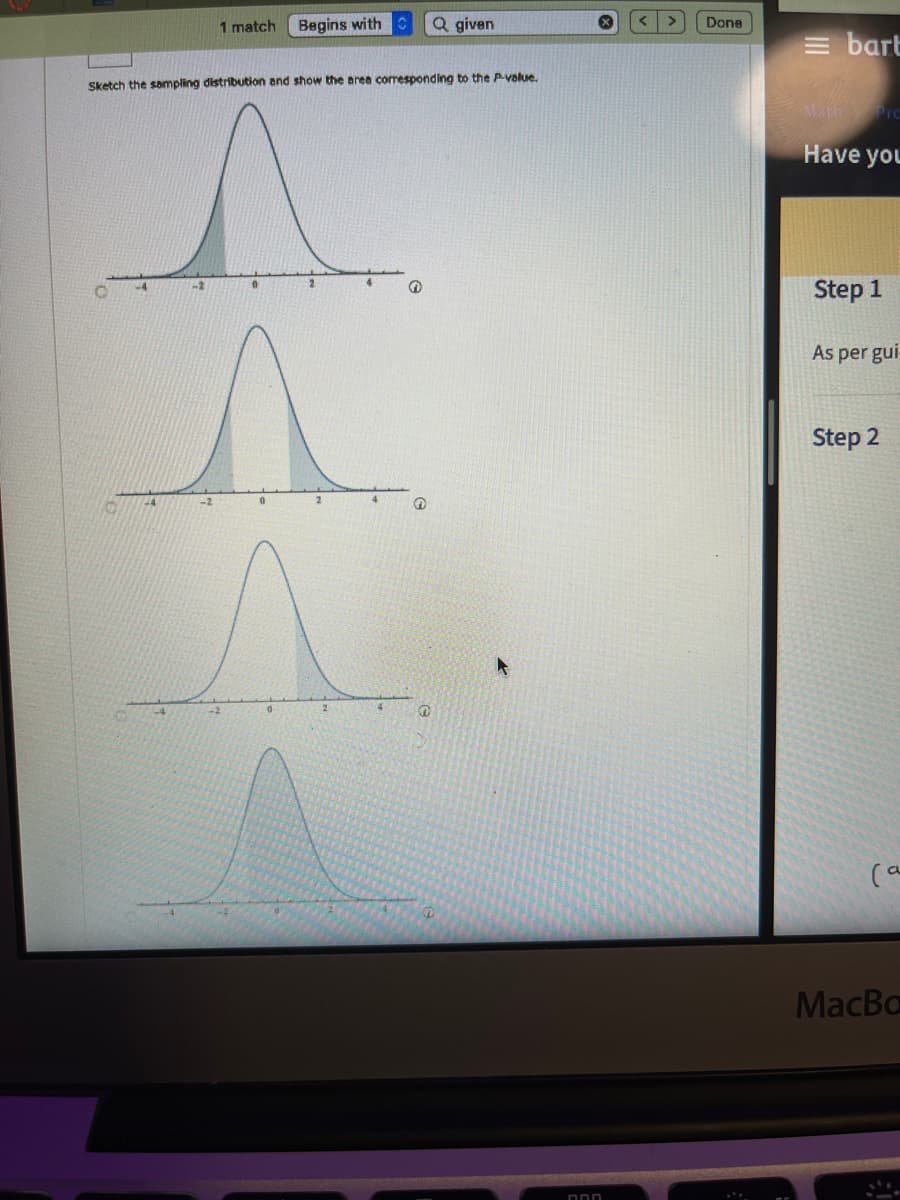
A USE SALT (a) State the null hypotheses Ho and the alternate hypothesis H,. Ho: H -Select- H: Select-. (b) What is the value of the sample test statistic? (Round your answer to three decimal places.) (c) Calculate the P-value. (Round your answer to four decimal places.) Sketch the sampling distribution and show the area corresponding to the P-value. -2

MATLAB: An Introduction with Applications
6th Edition
ISBN:9781119256830
Author:Amos Gilat
Publisher:Amos Gilat
Chapter1: Starting With Matlab
Section: Chapter Questions
Problem 1P
icon
Related questions
icon
Concept explainers
Topic Video
Question
100%
Pyramid Lake is on the Palute Indian Reservation in Nevada. The lake is famous for cutthroat trout. Suppose a tells you that the average length of trout caught in Pyramid Lake Is mu = 19 Inches. Howevera survey reported that of a random sample of 46 fish caught, the mean length was overline x =18.6 lnch , with estimated standard s = 2.7 inches. these data Indicate that the average length of a trout caught in Pyramid Lake less than mu = 19 inches? Use a=0.05 Please answer parts A,B, & C
A USE SALT
(a) State the null hypotheses Ho and the alternate hypothesis H,.
Ho: H-Select-
H,H -Select---
(b) What is the value of the sample test statistic? (Round your answer to three decimal places.)
(c) Calculate the P-value. (Round your answer to four decimal places.)
Sketch the sampling distribution and show the area corresponding to the P-value.
Mac
SC
임 F3
D00
F1
F2
F4
E5
%24
Transcribed Image Text:A USE SALT (a) State the null hypotheses Ho and the alternate hypothesis H,. Ho: H-Select- H,H -Select--- (b) What is the value of the sample test statistic? (Round your answer to three decimal places.) (c) Calculate the P-value. (Round your answer to four decimal places.) Sketch the sampling distribution and show the area corresponding to the P-value. Mac SC 임 F3 D00 F1 F2 F4 E5 %24
1 match
Begins with
Q given
Done
= bart
Sketch the sampling distribution and show the area corresponding to the P-value.
Math Prc
Have you
-4
-2
Step 1
As per gui
Step 2
-2
(a
MacBa
Transcribed Image Text:1 match Begins with Q given Done = bart Sketch the sampling distribution and show the area corresponding to the P-value. Math Prc Have you -4 -2 Step 1 As per gui Step 2 -2 (a MacBa
Expert Solution
trending now

Trending now

This is a popular solution!

steps

Step by step

Solved in 2 steps with 2 images

Blurred answer
Knowledge Booster
Centre, Spread, and Shape of a Distribution
Learn more about
Need a deep-dive on the concept behind this application? Look no further. Learn more about this topic, statistics and related others by exploring similar questions and additional content below.
Recommended textbooks for you
MATLAB: An Introduction with Applications
Statistics
ISBN:
9781119256830
Author:
Amos Gilat
Publisher:
John Wiley & Sons Inc
Probability and Statistics for Engineering and th…
Statistics
ISBN:
9781305251809
Author:
Jay L. Devore
Publisher:
Cengage Learning
Statistics for The Behavioral Sciences (MindTap C…
Statistics
ISBN:
9781305504912
Author:
Frederick J Gravetter, Larry B. Wallnau
Publisher:
Cengage Learning
Elementary Statistics: Picturing the World (7th E…
Statistics
ISBN:
9780134683416
Author:
Ron Larson, Betsy Farber
Publisher:
PEARSON
The Basic Practice of Statistics
Statistics
ISBN:
9781319042578
Author:
David S. Moore, William I. Notz, Michael A. Fligner
Publisher:
W. H. Freeman
Introduction to the Practice of Statistics
Statistics
ISBN:
9781319013387
Author:
David S. Moore, George P. McCabe, Bruce A. Craig
Publisher:
W. H. Freeman