A very large company is interested in its employees' productivity. The company reports from its historical data that its employees spend a mean of 164 minutes per employee (on a typical day) dealing with email. To test this claim, an independent consultant chooses 26 employees at random and finds that those employees spend a sample mean of 172 minutes dealing with email, with a sample standard deviation of 21 minutes. Assume that the population of amounts of time employees spend dealing with email is approximately normally distributed. Complete the parts below to perform a hypothesis test to see if there is enough evidence, at the 0.05 level of significance, to reject the claim that μ, the mean number of minutes employees spend dealing with email, is equal to 164.
A very large company is interested in its employees' productivity. The company reports from its historical data that its employees spend a mean of 164 minutes per employee (on a typical day) dealing with email. To test this claim, an independent consultant chooses 26 employees at random and finds that those employees spend a sample mean of 172 minutes dealing with email, with a sample standard deviation of 21 minutes. Assume that the population of amounts of time employees spend dealing with email is approximately normally distributed. Complete the parts below to perform a hypothesis test to see if there is enough evidence, at the 0.05 level of significance, to reject the claim that μ, the mean number of minutes employees spend dealing with email, is equal to 164.

MATLAB: An Introduction with Applications
6th Edition
ISBN:9781119256830
Author:Amos Gilat
Publisher:Amos Gilat
Chapter1: Starting With Matlab
Section: Chapter Questions
Problem 1P

Related questions
Question
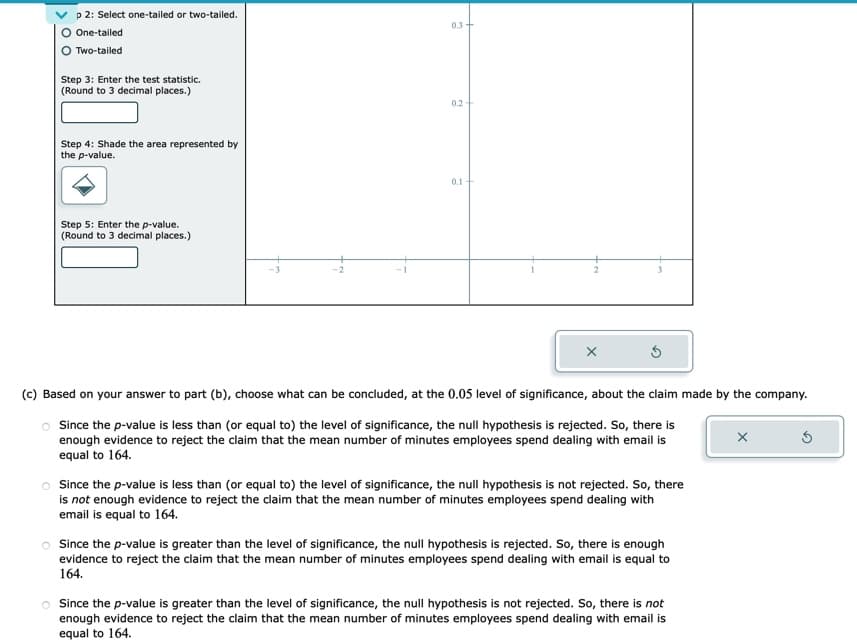
Transcribed Image Text:p 2: Select one-tailed or two-tailed.
One-tailed
Two-tailed
Step 3: Enter the test statistic.
(Round to 3 decimal places.)
Step 4: Shade the area represented by
the p-value.
Step 5: Enter the p-value.
(Round to 3 decimal places.)
0.3+
0.2
0.1
X
(c) Based on your answer to part (b), choose what can be concluded, at the 0.05 level of significance, about the claim made by the company.
o Since the p-value is less than (or equal to) the level of significance, the null hypothesis is rejected. So, there is
enough evidence to reject the claim that the mean number of minutes employees spend dealing with email is
equal to 164.
Since the p-value is less than (or equal to) the level of significance, the null hypothesis is not rejected. So, there
is not enough evidence to reject the claim that the mean number of minutes employees spend dealing with
email is equal to 164.
o Since the p-value is greater than the level of significance, the null hypothesis is rejected. So, there is enough
evidence to reject the claim that the mean number of minutes employees spend dealing with email is equal to
164.
o Since the p-value is greater than the level of significance, the null hypothesis is not rejected. So, there is not
enough evidence to reject the claim that the mean number of minutes employees spend dealing with email is
equal to 164.
x
Ś
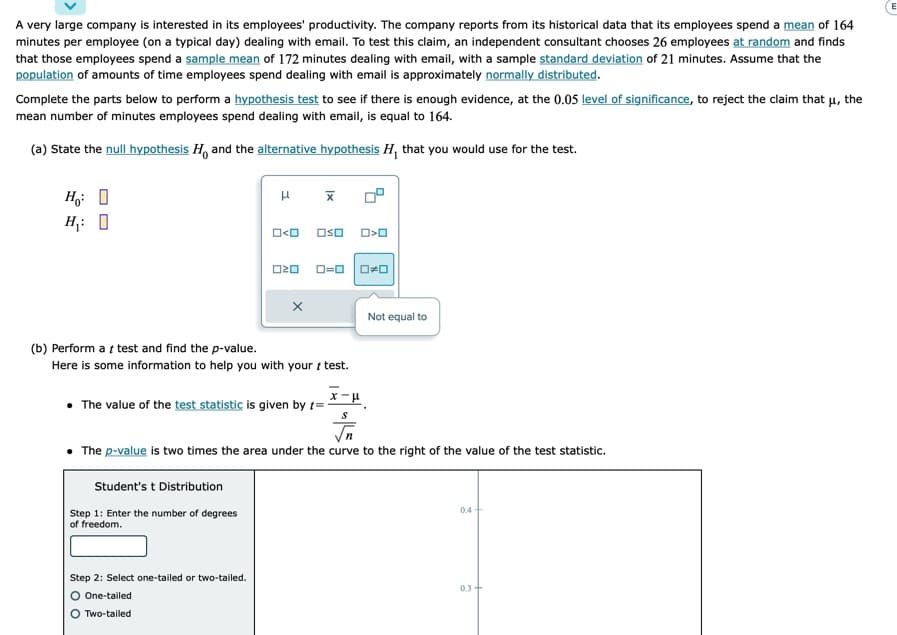
Transcribed Image Text:A very large company is interested in its employees' productivity. The company reports from its historical data that its employees spend a mean of 164
minutes per employee (on a typical day) dealing with email. To test this claim, an independent consultant chooses 26 employees at random and finds
that those employees spend a sample mean of 172 minutes dealing with email, with a sample standard deviation of 21 minutes. Assume that the
population of amounts of time employees spend dealing with email is approximately normally distributed.
Complete the parts below to perform a hypothesis test to see if there is enough evidence, at the 0.05 level of significance, to reject the claim that μ, the
mean number of minutes employees spend dealing with email, is equal to 164.
(a) State the null hypothesis H. and the alternative hypothesis H, that you would use for the test.
Ho D
H₁: 0
H
O<O
Student's t Distribution
Step 1: Enter the number of degrees
of freedom.
020
Step 2: Select one-tailed or two-tailed.
One-tailed
Two-tailed
X
x
OSO O>O
(b) Perform at test and find the p-value.
Here is some information to help you with your / test.
ローロ
• The value of the test statistic is given by t= -
x-μ
S
√n
The p-value is two times the area under the curve to the right of the value of the test statistic.
0*0
Not equal to
0.4+
0.3+
E
Expert Solution
This question has been solved!
Explore an expertly crafted, step-by-step solution for a thorough understanding of key concepts.

This is a popular solution!

Trending now
This is a popular solution!

Step by step
Solved in 4 steps with 1 images

Recommended textbooks for you
MATLAB: An Introduction with Applications
Statistics
ISBN:
9781119256830
Author:
Amos Gilat
Publisher:
John Wiley & Sons Inc

Probability and Statistics for Engineering and th…
Statistics
ISBN:
9781305251809
Author:
Jay L. Devore
Publisher:
Cengage Learning

Statistics for The Behavioral Sciences (MindTap C…
Statistics
ISBN:
9781305504912
Author:
Frederick J Gravetter, Larry B. Wallnau
Publisher:
Cengage Learning
MATLAB: An Introduction with Applications
Statistics
ISBN:
9781119256830
Author:
Amos Gilat
Publisher:
John Wiley & Sons Inc
Probability and Statistics for Engineering and th…
Statistics
ISBN:
9781305251809
Author:
Jay L. Devore
Publisher:
Cengage Learning
Statistics for The Behavioral Sciences (MindTap C…
Statistics
ISBN:
9781305504912
Author:
Frederick J Gravetter, Larry B. Wallnau
Publisher:
Cengage Learning

Elementary Statistics: Picturing the World (7th E…
Statistics
ISBN:
9780134683416
Author:
Ron Larson, Betsy Farber
Publisher:
PEARSON

The Basic Practice of Statistics
Statistics
ISBN:
9781319042578
Author:
David S. Moore, William I. Notz, Michael A. Fligner
Publisher:
W. H. Freeman

Introduction to the Practice of Statistics
Statistics
ISBN:
9781319013387
Author:
David S. Moore, George P. McCabe, Bruce A. Craig
Publisher:
W. H. Freeman