(a) What is the five number summary for this data?itales de lo coltoob. (font) bus) (b) Check if there are outliers in the data. op ma esinu oda ady (pose od ar (c) Draw a modified boxplot.
(a) What is the five number summary for this data?itales de lo coltoob. (font) bus) (b) Check if there are outliers in the data. op ma esinu oda ady (pose od ar (c) Draw a modified boxplot.

Trigonometry (MindTap Course List)
8th Edition
ISBN:9781305652224
Author:Charles P. McKeague, Mark D. Turner
Publisher:Charles P. McKeague, Mark D. Turner
Chapter8: Complex Numbers And Polarcoordinates
Section: Chapter Questions
Problem 2RP: A Bitter Dispute With the publication of Ars Magna, a dispute intensified between Jerome Cardan and...

Related questions
Question
100%
number 26 please :)
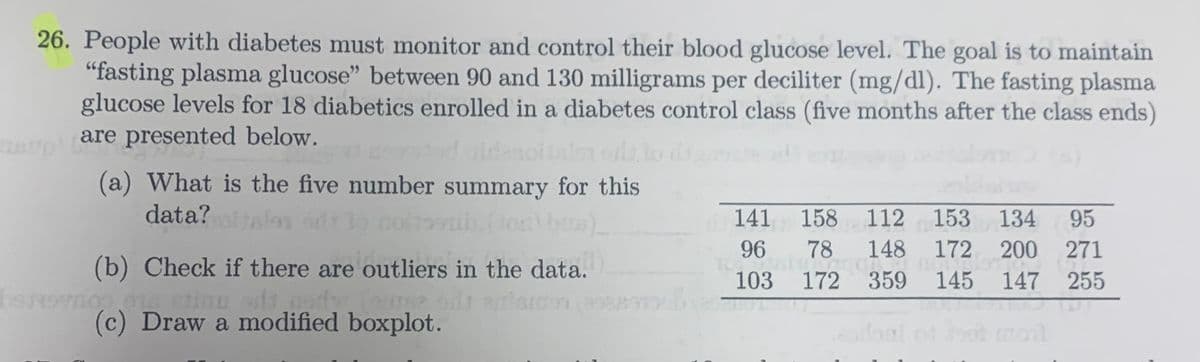
Transcribed Image Text:26. People with diabetes must monitor and control their blood glucose level. The goal is to maintain
"fasting plasma glucose" between 90 and 130 milligrams per deciliter (mg/dl). The fasting plasma
glucose levels for 18 diabetics enrolled in a diabetes control class (five months after the class ends)
are presented below.
(a) What is the five number summary for this
data?
59b. (10) b)
(b) Check if there are outliers in the data..
ady, (curse odr
(c) Draw a modified boxplot.
herovnop ois etimo ad
141 158 112 153 134 95
148 172 200 271
96
78
1028 172 €350 00
145 147 255
Broil
Expert Solution
Step 1
The data is given from 18 diabetics enrolled in a diabetes control class.
Sample size (n) = 18
To find the five-number summary and draw a boxplot.
To check if there are any outliers.

Step by step
Solved in 2 steps with 1 images

Recommended textbooks for you
Trigonometry (MindTap Course List)
Trigonometry
ISBN:
9781305652224
Author:
Charles P. McKeague, Mark D. Turner
Publisher:
Cengage Learning
Trigonometry (MindTap Course List)
Trigonometry
ISBN:
9781305652224
Author:
Charles P. McKeague, Mark D. Turner
Publisher:
Cengage Learning