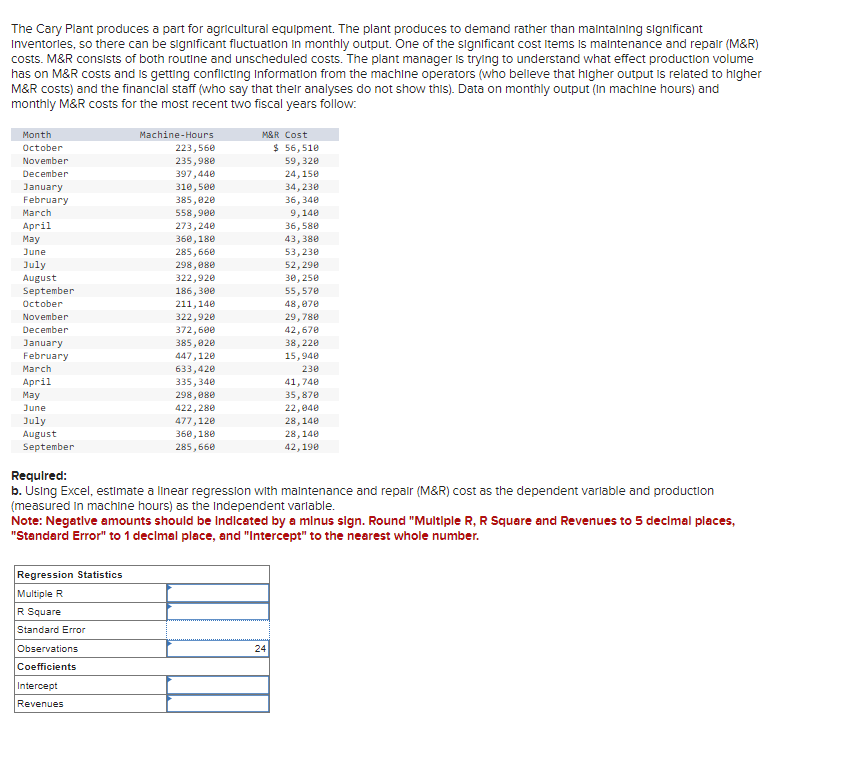
The Cary Plant produces a part for agricultural equipment. The plant produces to demand rather than maintaining significant Inventories, so there can be significant fluctuation in monthly output. One of the significant cost Items is maintenance and repair (M&R) costs. M&R consists of both routine and unscheduled costs. The plant manager is trying to understand what effect production volume has on M&R costs and is getting conflicting Information from the machine operators (who believe that higher output is related to higher M&R costs) and the financial staff (who say that their analyses do not show this). Data on monthly output (In machine hours) and monthly M&R costs for the most recent two fiscal years follow: Month October November December January February March April May June July August September October November December January February March April May June July August September Regression Statistics Multiple R R Square Standard Error Machine-Hours 223,560 235,980 397,440 Observations Coefficients 310,500 385,020 Intercept Revenues 558,900 273,240 360,180 285,660 298,080 322,920 186,300 211,140 322,920 372,600 385,020 447,120 633,420 335,340 298,080 422,280 477,120 360,180 285,660 M&R Cost $ 56,510 59,320 24,150 34,230 36,340 Required: b. Using Excel, estimate a linear regression with maintenance and repair (M&R) cost as the dependent variable and production (measured in machine hours) as the independent variable. 9,140 36,580 43,380 53,230 52,290 30,250 Note: Negative amounts should be indicated by a minus sign. Round "Multiple R, R Square and Revenues to 5 decimal places, "Standard Error" to 1 decimal place, and "Intercept" to the nearest whole number. 24 55,570 48,070 29,780 42,670 38,220 15,940 230 41,740 35,870 22,040 28,140 28,140 42,190
The Cary Plant produces a part for agricultural equipment. The plant produces to demand rather than maintaining significant Inventories, so there can be significant fluctuation in monthly output. One of the significant cost Items is maintenance and repair (M&R) costs. M&R consists of both routine and unscheduled costs. The plant manager is trying to understand what effect production volume has on M&R costs and is getting conflicting Information from the machine operators (who believe that higher output is related to higher M&R costs) and the financial staff (who say that their analyses do not show this). Data on monthly output (In machine hours) and monthly M&R costs for the most recent two fiscal years follow: Month October November December January February March April May June July August September October November December January February March April May June July August September Regression Statistics Multiple R R Square Standard Error Machine-Hours 223,560 235,980 397,440 Observations Coefficients 310,500 385,020 Intercept Revenues 558,900 273,240 360,180 285,660 298,080 322,920 186,300 211,140 322,920 372,600 385,020 447,120 633,420 335,340 298,080 422,280 477,120 360,180 285,660 M&R Cost $ 56,510 59,320 24,150 34,230 36,340 Required: b. Using Excel, estimate a linear regression with maintenance and repair (M&R) cost as the dependent variable and production (measured in machine hours) as the independent variable. 9,140 36,580 43,380 53,230 52,290 30,250 Note: Negative amounts should be indicated by a minus sign. Round "Multiple R, R Square and Revenues to 5 decimal places, "Standard Error" to 1 decimal place, and "Intercept" to the nearest whole number. 24 55,570 48,070 29,780 42,670 38,220 15,940 230 41,740 35,870 22,040 28,140 28,140 42,190

MATLAB: An Introduction with Applications
6th Edition
ISBN:9781119256830
Author:Amos Gilat
Publisher:Amos Gilat
Chapter1: Starting With Matlab
Section: Chapter Questions
Problem 1P

Related questions
Question
Sh4
Transcribed Image Text:The Cary Plant produces a part for agricultural equipment. The plant produces to demand rather than maintaining significant
Inventories, so there can be significant fluctuation in monthly output. One of the significant cost Items is maintenance and repair (M&R)
costs. M&R consists of both routine and unscheduled costs. The plant manager is trying to understand what effect production volume
has on M&R costs and is getting conflicting Information from the machine operators (who believe that higher output is related to higher
M&R costs) and the financial staff (who say that their analyses do not show this). Data on monthly output (in machine hours) and
monthly M&R costs for the most recent two fiscal years follow:
Month
October
November
December
January
February
March
April
May
June
July
August
September
October
November
December
January
February
March
April
May
June
July
August
September
Regression Statistics
Multiple R
R Square
Standard Error
Machine-Hours
223,560
235,980
397,440
310,500
385,020
558,900
273,240
360,180
285,660
298,080
322,920
186,300
211,140
322,920
372,600
385,020
447,120
633,420
335,340
298,080
Observations
Coefficients
422,280
477,120
360,180
285,660
Intercept
Revenues
M&R Cost
$ 56,510
59,320
Required:
b. Using Excel, estimate a linear regression with maintenance and repair (M&R) cost as the dependent variable and production
(measured in machine hours) as the Independent variable.
24,150
34,230
36,340
Note: Negative amounts should be indicated by a minus sign. Round "Multiple R, R Square and Revenues to 5 decimal places,
"Standard Error" to 1 decimal place, and "Intercept" to the nearest whole number.
24
9,140
36,580
43,380
53,230
52, 290
30,250
55,570
48,070
29,780
42,670
38,220
15,940
230
41,740
35,870
22,040
28,140
28,140
42,190
Expert Solution
This question has been solved!
Explore an expertly crafted, step-by-step solution for a thorough understanding of key concepts.

This is a popular solution!

Trending now
This is a popular solution!

Step by step
Solved in 3 steps with 2 images

Recommended textbooks for you
MATLAB: An Introduction with Applications
Statistics
ISBN:
9781119256830
Author:
Amos Gilat
Publisher:
John Wiley & Sons Inc

Probability and Statistics for Engineering and th…
Statistics
ISBN:
9781305251809
Author:
Jay L. Devore
Publisher:
Cengage Learning

Statistics for The Behavioral Sciences (MindTap C…
Statistics
ISBN:
9781305504912
Author:
Frederick J Gravetter, Larry B. Wallnau
Publisher:
Cengage Learning
MATLAB: An Introduction with Applications
Statistics
ISBN:
9781119256830
Author:
Amos Gilat
Publisher:
John Wiley & Sons Inc
Probability and Statistics for Engineering and th…
Statistics
ISBN:
9781305251809
Author:
Jay L. Devore
Publisher:
Cengage Learning
Statistics for The Behavioral Sciences (MindTap C…
Statistics
ISBN:
9781305504912
Author:
Frederick J Gravetter, Larry B. Wallnau
Publisher:
Cengage Learning

Elementary Statistics: Picturing the World (7th E…
Statistics
ISBN:
9780134683416
Author:
Ron Larson, Betsy Farber
Publisher:
PEARSON

The Basic Practice of Statistics
Statistics
ISBN:
9781319042578
Author:
David S. Moore, William I. Notz, Michael A. Fligner
Publisher:
W. H. Freeman

Introduction to the Practice of Statistics
Statistics
ISBN:
9781319013387
Author:
David S. Moore, George P. McCabe, Bruce A. Craig
Publisher:
W. H. Freeman