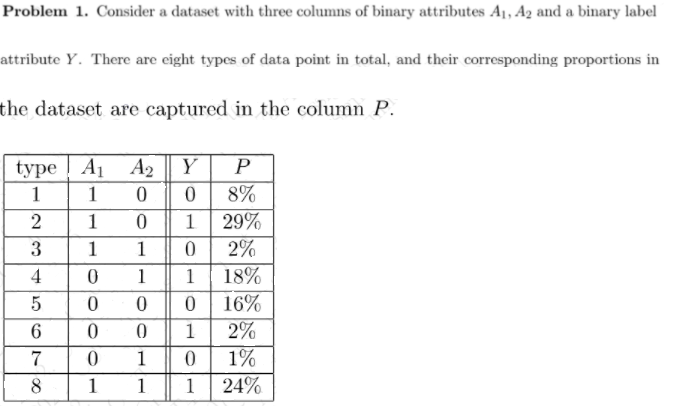
(a) What is the GINI index of the dataset? (b) What is the GINI index of the split on


Q: a) Verify that the conditions for the use of the normal model are met using the 2015 study. b) Why…
A: Given Information: Sample size n=100 Sample proportion p^=0.62 Hypothesized value of population…
Q: though a large.number o! tasks in the computer industry are robotic, many operations r human…
A: Given information: X Y X^2 Y^2 XY 79 93 6241 8649 7347 81 93 6561 8649 7533 79 94 6241 8836…
Q: (a) Use the empirical rule to estimate the number of farms whose land and building values per acre…
A:
Q: 1. The grades on a chemistry midterm at Springer are roughly symmetric with e-67, and o-2. William…
A: Given that. X~N( μ , ?^2 ) μ=67 , ?=2 , x=65 Z-score =( x - μ )/?
Q: Learning the Mechanics 7.7 Find za/2 for each of the following: a. a = .10 c. a = .05 NW b. a = .01…
A: 7.7. a. The critical value is zα/2 of the standard normal distribution, above which α/2 proportion…
Q: The following results are from data that were collected from a sample of Chicago Cubs baseball…
A: Let Y (dependent variable represents the attendance, X1 represents Temp, X2 represents win%, X3…
Q: Reynaldo is conducting a one-sample z-test of the null hypothesis Ho : p = 0.64 against the…
A:
Q: The loaves of bread are normally distributed with a mean length of 32 cm with standard deviations…
A: As per company guidelines I solved only First questions.thank you
Q: Part b and c of the question: Part b: Find the mean number of hurricanes. (Type an integer or…
A: We are given number of hurricanes and frequencies associated with it.
Q: A coin is tossed 25 times. Estimate the chance of getting 12 heads and 13 tails.
A: Given that Number of times coin tossed (n) = 25 We know that Probability = Number of favorable…
Q: are asked about their preferences. (C) Use the Chebyshev's inequality to estimate p(X – 4| 2 1) –…
A:
Q: Hint(s) Check My Work (No more tries available) At Western University the historical mean of…
A:
Q: What is the relationship between the attendance at a major league ball game and the total number of…
A: The independent variable is Attendance. The dependent variable is Runs. This is simple linear…
Q: The number and frequency of a certain ocean's hurricanes annually from 1930 through 2005 is shown…
A: In statistical hypothesis test, a chi-square test, or specifically Pearson's chi-square test is…
Q: Adult men have heights with a mean of 69.0 inches and a standard deviation of 2.8 inches. Find the…
A:
Q: Q/ In the vehicle speed test, the results are given in the table below: Find 1. Arithmetic mean 2.…
A: Solution: Given data
Q: Problem 2 A class contains seven boys and eight girls. (a) If two are selected at random to leave…
A: Given that a class contains 7 boys and 8 girls and using this information we have to find the…
Q: Please help me carry out all the checks to assess if it shows roughly normal distribution in the…
A: The objective is to determine whether the Q-Q plot shows a roughly normal distribution in the…
Q: 10. The following is the equation for a regression line concerning square footage and rent for…
A:
Q: The price X (dollars per pound) and consumption y (in pounds per capita) of beef were samples for 10…
A: For the given data Standard error ( Se ) =?
Q: A physical therapist wanted to know whether the mean step pulse of men was less than the mean step…
A:
Q: 3. Represent the data by a simple bar diagram. Countries: A D E F Production of Rice (000`s tons):…
A:
Q: The time spent waiting in the line is approximately normally distributed. The mean waiting time is 5…
A: Here, mean is 5 and standard deviation is 3. We will use z-standard normal distribution.
Q: i) By using Figure 8, the predicted values for life satisfaction for different countries may be…
A: The scatter plot is a visual representation of relationship between two scale variables.
Q: = (Enter 3 decimal places) z = (Round to 2 decimal places) P-value = (Enter at least 4 decimal…
A: We have given that Population proportion p = 0.55 Favourable cases, X = 128 Sample size n = 200…
Q: Exercise 6.5 Consider a fully discrete 10-year term insurance issued to a select life aged 50, with…
A: Given Insurance type : Term insurance Age : 50 years Sum insured : $100000…
Q: Il'ustration 22.9. The l columnof a certain life-table for ages 0. 1. 2, 3. ..100 is given by series…
A:
Q: An experiment was performed to attempt to answer the question posed in Question 12. In the…
A: Given 95% CI for μsplit- μindividual is ($5.59,$21.67)
Q: A ball is drawn randomly from a jar that contains 3 red balls, 5 white balls, and 5 yellow balls.…
A: Solution
Q: 2. A psychologist estimates the I.Q of 28 students. The values are as follows: 103, 86, 94, 97, 100,…
A:
Q: A recent poll randomly sampled 100 unemployed and 950 employed Canadians and asked them about their…
A: Assume that p1 and p2 are the true population proportions of employed and unemployed Canadians, who…
Q: *Q(4.) * A store opens at 8 a.m. From 8 until 10, customers arrive at a Poisson rate of 10 an hour.…
A:
Q: 3. Represent the data by a simple bar diagram. Countries: D E. Production of Rice (000`s tons): 29…
A:
Q: to determine the age of each object. The machine correctly determines the age of 78 of the objects…
A: Given that Sample size n =100 Favorable cases x =78 Sample proportion p^=x/n =78/100 =0.78
Q: interested in predicting the number of weekly riders on the public buses using the following…
A: *Answer: The new data set is No of weekly riders Population of city Monthly income of riders…
Q: Solve the following problems and answer the following questions, based upon the following context,…
A: From the given information, P(Bronze)=P(Silver)=1/2P(Gold)=1/2P(Platinum).
Q: maximum fee you would be willing to pay for delivery maximum fee you would be willing to pay for…
A: Given: Sr. No. Female (x1) Male (x2) 1 2.99 5 2 5 5 3 5 10 4 5 10 5 5 10 6 5 10 7…
Q: Due to stress, many patients who undergo major elective surgery experience an increase in blood…
A: It is needed to find the appropriate statistical test.
Q: Experiments on learning in animals sometimes measure how long it takes mice to find their way…
A:
Q: (a) Construct a grouped frequency distribution for the data. Use 85-89 for the first class and use…
A: Given that The data are…
Q: The following data are US exports to Mexico. Complete the missing values. **PLEASE COMPLETE THE…
A: Given the following data are US exports to Mexico. Please find the explanation below. Thank you.
Q: (a) Estimate the number of pistons in the sample that are defective by giving the mean of the…
A: HERE given, p =probability that piston is defective = 0.01 n = 80
Q: Test scores Frequency 31 – 40 4 41 - 50 51 – 60 5 61 – 70 71- 80 81 - 90 8 11 7
A: The distribution of test score is Test scores Frequency 31-40 4 41-50 3 51-60 5 61-70 8…
Q: The Ministry of Health is interested in determining whether the average nicotine content of regular,…
A: Given that The excel output of the problem is Given below Hence no alpha is Given taken alpha as…
Q: A marketing consultant observes 50 consecutive shoppers at a supermarket, recording how much each…
A: The sample is the any fraction of the population that explains the true population characteristic.…
Q: Šample 2 Assume that both populations are normally distributed. a) Test whether u, >H2 at the a =…
A: a) Assume that the variance of 1st population is σ12 and the variance of 2nd population is σ22.
Q: If Rita receives $39.24 interest for a deposit earning 6% simple interest for 110 days, what is the…
A:
Q: Problem 2 Two random processes are defined by X (t) = Asin(@t +0) Y(t) = B sin(@t+0) where 0 is a…
A:
Q: linear regression model the predictor gender has two categories and the predictor school level has…
A: In a linear regression model, there are two predictors gender and school level.
Q: A multiple regression analysis produced the following tables. Summary Output…
A: The intercept value is 1959.709718.
(a) What is the GINI index of the dataset?
(b) What is the GINI index of the split on A1 and that on A2 respectively?

Step by step
Solved in 3 steps with 2 images

- one -Let there be three levels of the row variable and four levels of the column variable in a crosstab. If there are 150 observations at the 1st level of the row variable, 150 at the 2nd level and 70 at the 3rd level, 130 observations at the 1st level of the column variable, 20 at the 2nd level and 100 observations at the 3rd level, which of the following is the sample size?a)430 B)870 NS)620 D)560 TO)370Problem 4 Car manufacturers are interested in whether there is a relationship between the size of car an individual drives and the number of people in the driver’s family (that is, whether car size and family size are independent). To test this, suppose that 800 car owners were randomly surveyed with the following results. Conduct a test for independence. Family Size Sub & Compact Mid-size Full-size Van & Truck 1 20 35 40 35 2 20 50 70 80 3 - 4 20 50 100 90 5+ 20 30 70 70 TABLE 2This problem is based on problems 18.1, 18.2, 18.9, & 18.10 from Lomax & Hahs-Vaughn, 3rd ed.You are given the following data, where X1 (final percentage in math class) and X2 (number of absences) are used to predict YY (standardized math test score in fifth grade): YY X1X1 X2X2 350 78 3 390 80 1 375 88 3 345 70 3 450 89 1 485 99 0 415 95 2 410 72 1 400 82 0 420 80 2 375 92 6 480 98 0 Determine the following multiple regression values.Report intercept and slopes for regression equation accurate to 3 decimal places: Intercept: a= Partial slope X1: b1= Partial slope X2: b2=Report sum of squares and coefficient of multiple determination accurate to 3 decimal places: R2= SSTotal= Test the significance of the overall regression model (report F-ratio accurate to 3 decimal places and P-value accurate to 4 decimal places): F-ratio = P-value = Report the variance of the residuals accurate to 3 decimal places: MSres= Report the…
- Problem 2: Naïve Bayes Classification In order to reduce my email load, I decide to use a classifier to decide whether or not I should read an email, or simply file it away instead. To train my model, I obtain the following data set of binary-valued features about each email, including whether I know the author or not, whether the email is long or short, and whether it has any of several key words, along with my final decision about whether to read it ( y = +1 for “read”, y = −1 for “discard”). Help me build the classifier. Know author? Is long? Has “research”? Has “grade”? Has “lottery”? Read? X1 X2 X3 X4 X5 Y 0 0 1 1 0 -1 1 1 0 1 0 -1 0 1 1 1 1 -1 1 1 1 1 0 -1 0 1 0 0 0 -1 1 0 1 1 1 1 0 0 1 0 0 1 1 0 0 0 0 1 1 0 1 1 0 1 1 1 1 1 1 -1 In the case of any ties, predict class +1. Use naïve Bayes classifier to make…A problem with a phone line that prevents a customer from receiving or making calls is upsetting to both the customer and the telecommunications company. The file Phone contains samples of 20 problems reported to two different offices of a telecommunications company and the time to clear these problems (in minutes) from the customers’ lines Central Office I Time to Clear Problems (minutes) 1.48 1.75 0.78 2.85 0.52 1.60 4.15 3.97 1.48 3.10 1.02 0.53 0.93 1.60 0.80 1.05 6.32 3.93 5.45 0.97 Central Office II Time to Clear Problems (minutes) 7.55 3.75 0.10 1.10 0.60 0.52 3.30 2.10 0.58 4.02 3.75 0.65 1.92 0.60 1.53 4.23 0.08 1.48 1.65 0.72 Perform a hypothesis test to determine if there’s evidence in this data of a difference in the mean waiting time between the two offices by answering the following questions: (a) What are the null and alternate hypotheses for this test? (b) Assuming that the population variances from both offices are equal, what is…A problem with a phone line that prevents a customer from receiving or making calls is upsetting to both the customer and the telecommunications company. The file Phone contains samples of 20 problems reported to two different offices of a telecommunications company and the time to clear these problems (in minutes) from the customers’ lines: Central Office I Time to Clear Problems (minutes) 1.48 1.75 0.78 2.85 0.52 1.60 4.15 3.97 1.48 3.10 1.02 0.53 0.93 1.60 0.80 1.05 6.32 3.93 5.45 0.97 Central Office II Time to Clear Problems (minutes) 7.55 3.75 0.10 1.10 0.60 0.52 3.30 2.10 0.58 4.02 3.75 0.65 1.92 0.60 1.53 4.23 0.08 1.48 1.65 0.72 Perform a hypothesis test to determine if there’s evidence in this data of a difference in the mean waiting time between the two offices by answering the following questions: (b) Assuming that the population…
- A problem with a phone line that prevents a customer from receiving or making calls is upsetting to both the customer and the telecommunications company. The file “Phone” contains samples of 20 problems reported to two different offices of a telecommunications company and the time toclear these problems (in minutes) from the customers’ lines: Central Office I Time to Clear Problems (minutes) 1.48 1.75 0.78 2.85 0.52 1.60 4.15 3.97 1.48 3.10 1.02 0.53 0.93 1.60 0.80 1.05 6.32 3.93 5.45 0.97 Central Office II Time to Clear Problems (minutes) 7.55 3.75 0.10 1.10 0.60 0.52 3.30 2.10 0.58 4.02 3.75 0.65 1.92 0.60 1.53 4.23 0.08 1.48 1.65 0.72 Assuming that the population variances from both offices are not equal, is there evidence of a difference in the mean waiting time between two offices? (Use a = 0.01) ▪ You may need to download file “Phone”. Referring to Table 10-2, which of the following is an appropriate null hypothesis? Question 2 options: 1)…Problem 8. A common statistical test used in sensory discrimination experiments in food science (as well as consumer products like household cleaning products, cosmetics, etc) is the so-called triangle test.It is often described as follows. To determine whether there is a perceivable difference 3 between products say, an established soft drink and a newly developed soft drink with a cheaper recipeyou assemble a tasting panel and present each member with three samples (cups of soft drink), two of which are the same (say, the established recipe) and the other different (the cheaper recipe). The samples should look identical and be presented in random order to each taster. The taster is asked to select the one sample that's different from the other two. The total number k of correct selections (for the n tasters) would be the result of random guessing if there were no perceivable difference, so a 1/3 chance of being correct, so look up k in the table of the cumulative binomial…


