(a) What is the level of significance? (b) State the null and alternate hypotheses. Ho: P %3D 0.67; Н,: р<0.67 Ho: P %3D 0.67; H,: р#0.67 Ho: p = 0.67; H,: р > 0.67 Но: р< 0.67; Hi: р %3D 0.67 What sampling distribution will you use? The standard normal, since np < 5 and nq < 5. The Student's t, since np < 5 and ng < 5. The Student's t, since np > 5 and ng > 5. The standard normal, since np > 5 and nq > 5. What is the value of the sample test statistic? (Round your answer to two decimal places.) (c) Find the P-value of the test statistic. (Round your answer to four decimal places.)
(a) What is the level of significance? (b) State the null and alternate hypotheses. Ho: P %3D 0.67; Н,: р<0.67 Ho: P %3D 0.67; H,: р#0.67 Ho: p = 0.67; H,: р > 0.67 Но: р< 0.67; Hi: р %3D 0.67 What sampling distribution will you use? The standard normal, since np < 5 and nq < 5. The Student's t, since np < 5 and ng < 5. The Student's t, since np > 5 and ng > 5. The standard normal, since np > 5 and nq > 5. What is the value of the sample test statistic? (Round your answer to two decimal places.) (c) Find the P-value of the test statistic. (Round your answer to four decimal places.)

MATLAB: An Introduction with Applications
6th Edition
ISBN:9781119256830
Author:Amos Gilat
Publisher:Amos Gilat
Chapter1: Starting With Matlab
Section: Chapter Questions
Problem 1P

Related questions

Topic Video
Question
Women athletes at a certain university have a long-term graduation rate of 67%. Over the past several years, a random sample of 38 women athletes at the school showed that 23 eventually graduated. Does this indicate that the population proportion of women athletes who graduate from the university is now less than 67%? Use a 1% level of significance.
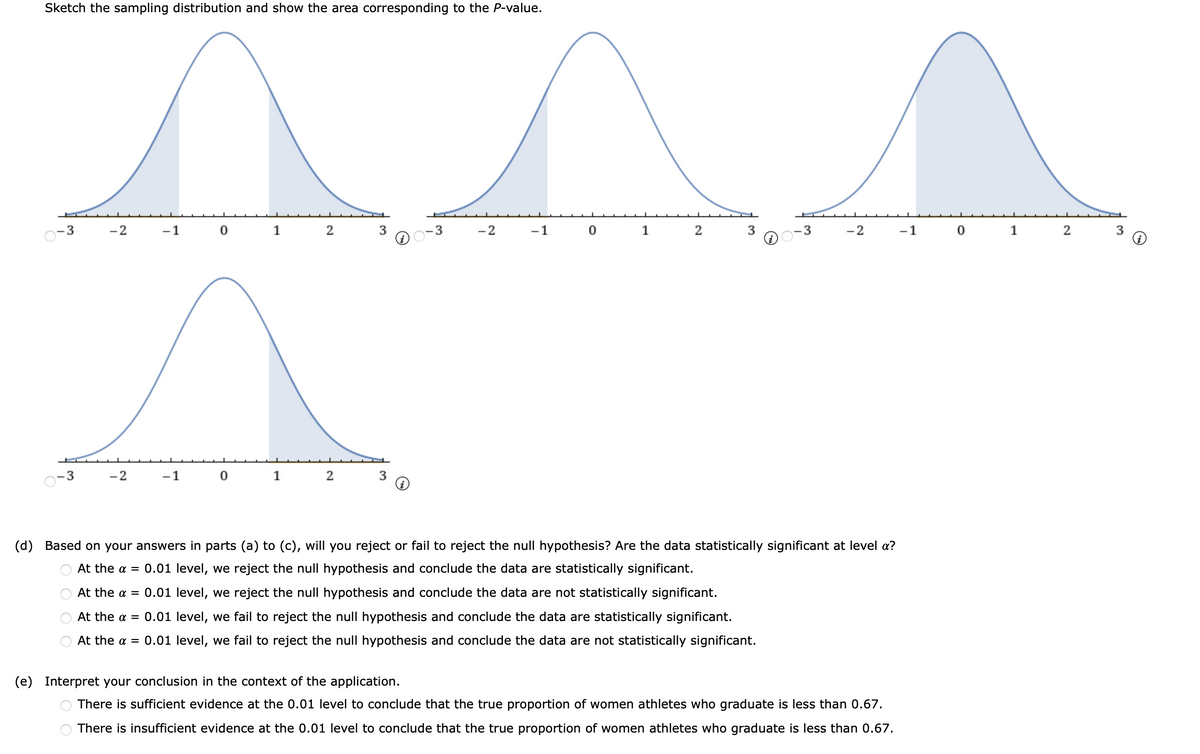
Transcribed Image Text:Sketch the sampling distribution and show the area corresponding to the P-value.
3
-2
-1 0 1 2
3
-2
-1 0
1
2
-3
-2
-1 0
1
2
-2
-1
1
(d) Based on your answers in parts (a) to (c), will you reject or fail to reject the null hypothesis? Are the data statistically significant at level a?
At the a = 0.01 level, we reject the null hypothesis and conclude the data are statistically significant.
At the a = 0.01 level, we reject the null hypothesis and conclude the data are not statistically significant.
At the a = 0.01 level, we fail to reject the null hypothesis and conclude the data are statistically significant.
At the a = 0.01 level, we fail to reject the null hypothesis and conclude the data are not statistically significant.
(e) Interpret your conclusion in the context of the application.
There is sufficient evidence at the 0.01 level to conclude that the true proportion of women athletes who graduate is less than 0.67.
There is insufficient evidence at the 0.01 level to conclude that the true proportion of women athletes who graduate is less than 0.67.
O O O O
Transcribed Image Text:(a) What is the level of significance?
(b) State the null and alternate hypotheses.
О Но: р 3D 0.67; H,: р <0.67
Ho: p =
0.67; H,: р + 0.67
О Но: р %3D 0.67; H,: р> 0.67
Но: Р < 0.67; Hi:р%3D0.67
What sampling distribution will you use?
The standard normal, since np < 5 and ng < 5.
The Student's t, since np < 5 and nq < 5.
The Student's t, since np > 5 and ng > 5.
The standard normal, since np > 5 and ng > 5.
What is the value of the sample test statistic? (Round your answer to two decimal places.)
(c) Find the P-value of the test statistic. (Round your answer to four decimal places.)
Expert Solution
This question has been solved!
Explore an expertly crafted, step-by-step solution for a thorough understanding of key concepts.

Step by step
Solved in 2 steps with 1 images

Knowledge Booster


Learn more about
Need a deep-dive on the concept behind this application? Look no further. Learn more about this topic, statistics and related others by exploring similar questions and additional content below.Recommended textbooks for you
MATLAB: An Introduction with Applications
Statistics
ISBN:
9781119256830
Author:
Amos Gilat
Publisher:
John Wiley & Sons Inc

Probability and Statistics for Engineering and th…
Statistics
ISBN:
9781305251809
Author:
Jay L. Devore
Publisher:
Cengage Learning

Statistics for The Behavioral Sciences (MindTap C…
Statistics
ISBN:
9781305504912
Author:
Frederick J Gravetter, Larry B. Wallnau
Publisher:
Cengage Learning
MATLAB: An Introduction with Applications
Statistics
ISBN:
9781119256830
Author:
Amos Gilat
Publisher:
John Wiley & Sons Inc
Probability and Statistics for Engineering and th…
Statistics
ISBN:
9781305251809
Author:
Jay L. Devore
Publisher:
Cengage Learning
Statistics for The Behavioral Sciences (MindTap C…
Statistics
ISBN:
9781305504912
Author:
Frederick J Gravetter, Larry B. Wallnau
Publisher:
Cengage Learning

Elementary Statistics: Picturing the World (7th E…
Statistics
ISBN:
9780134683416
Author:
Ron Larson, Betsy Farber
Publisher:
PEARSON

The Basic Practice of Statistics
Statistics
ISBN:
9781319042578
Author:
David S. Moore, William I. Notz, Michael A. Fligner
Publisher:
W. H. Freeman

Introduction to the Practice of Statistics
Statistics
ISBN:
9781319013387
Author:
David S. Moore, George P. McCabe, Bruce A. Craig
Publisher:
W. H. Freeman