a) What is the mean number of donors who have type O negative blood?

MATLAB: An Introduction with Applications
6th Edition
ISBN:9781119256830
Author:Amos Gilat
Publisher:Amos Gilat
Chapter1: Starting With Matlab
Section: Chapter Questions
Problem 1P

Related questions
Question
Transcribed Image Text:6.
7
8
9.
10
11
12
13
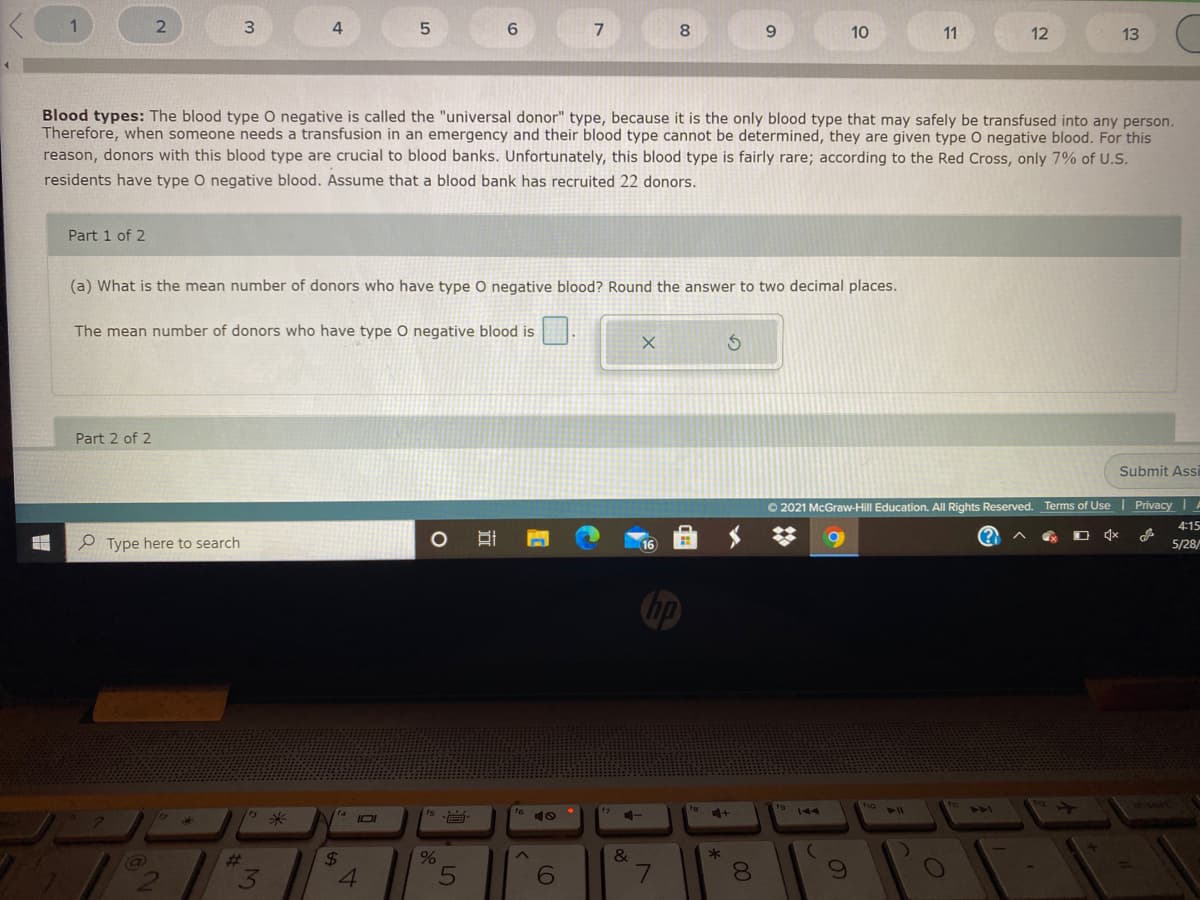
Blood types: The blood type O negative is called the "universal donor" type, because it is the only blood type that may safely be transfused into any person.
Therefore, when someone needs a transfusion in an emergency and their blood type cannot be determined, they are given type O negative blood. For this
reason, donors with this blood type are crucial to blood banks. Unfortunately, this blood type is fairly rare; according to the Red Cross, only 7% of U.S.
residents have type O negative blood. Assume that a blood bank has recruited 22 donors.
Part 1 of 2
(a) What is the mean number of donors who have type O negative blood? Round the answer to two decimal places.
The mean number of donors who have type 0 negative blood is
Part 2 of 2
Submit Assi
O 2021 McGraw-Hill Education. All Rights Reserved. Terms of Use Privacy A
4:15
e Type here to search
5/28/
16
hp
insern
to
404
IOI
10
&
%23
3
24
4.
6
7.
00
Expert Solution
This question has been solved!
Explore an expertly crafted, step-by-step solution for a thorough understanding of key concepts.

This is a popular solution!

Trending now
This is a popular solution!

Step by step
Solved in 2 steps

Recommended textbooks for you
MATLAB: An Introduction with Applications
Statistics
ISBN:
9781119256830
Author:
Amos Gilat
Publisher:
John Wiley & Sons Inc

Probability and Statistics for Engineering and th…
Statistics
ISBN:
9781305251809
Author:
Jay L. Devore
Publisher:
Cengage Learning

Statistics for The Behavioral Sciences (MindTap C…
Statistics
ISBN:
9781305504912
Author:
Frederick J Gravetter, Larry B. Wallnau
Publisher:
Cengage Learning
MATLAB: An Introduction with Applications
Statistics
ISBN:
9781119256830
Author:
Amos Gilat
Publisher:
John Wiley & Sons Inc
Probability and Statistics for Engineering and th…
Statistics
ISBN:
9781305251809
Author:
Jay L. Devore
Publisher:
Cengage Learning
Statistics for The Behavioral Sciences (MindTap C…
Statistics
ISBN:
9781305504912
Author:
Frederick J Gravetter, Larry B. Wallnau
Publisher:
Cengage Learning

Elementary Statistics: Picturing the World (7th E…
Statistics
ISBN:
9780134683416
Author:
Ron Larson, Betsy Farber
Publisher:
PEARSON

The Basic Practice of Statistics
Statistics
ISBN:
9781319042578
Author:
David S. Moore, William I. Notz, Michael A. Fligner
Publisher:
W. H. Freeman

Introduction to the Practice of Statistics
Statistics
ISBN:
9781319013387
Author:
David S. Moore, George P. McCabe, Bruce A. Craig
Publisher:
W. H. Freeman