a) Why do you think any serious researcher would use the sample mean as a measure center to estimate for the population parameter at most times? A
a) Why do you think any serious researcher would use the sample mean as a measure center to estimate for the population parameter at most times? A

Glencoe Algebra 1, Student Edition, 9780079039897, 0079039898, 2018
18th Edition
ISBN:9780079039897
Author:Carter
Publisher:Carter
Chapter4: Equations Of Linear Functions
Section: Chapter Questions
Problem 8SGR

Related questions
Topic Video
Question
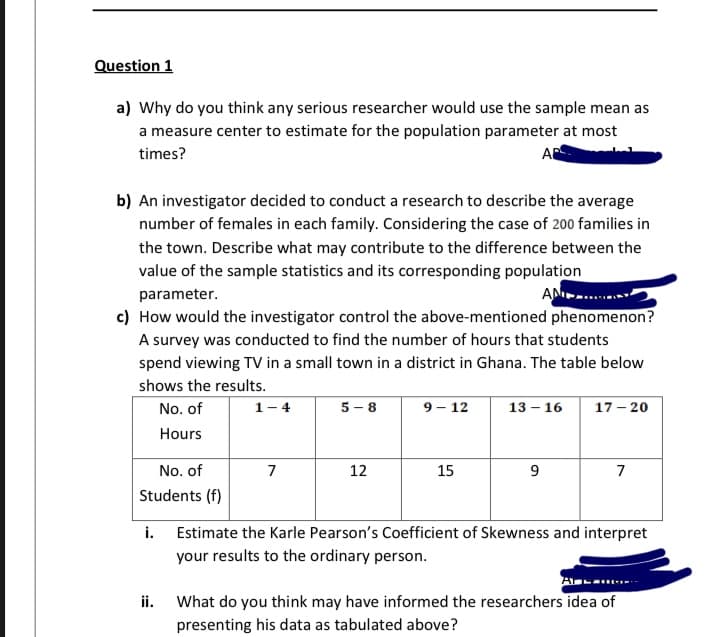
Transcribed Image Text:Question 1
a) Why do you think any serious researcher would use the sample mean as
a measure center to estimate for the population parameter at most
times?
A
b) An investigator decided to conduct a research to describe the average
number of females in each family. Considering the case of 200 families in
the town. Describe what may contribute to the difference between the
value of the sample statistics and its corresponding population
AN-..
c) How would the investigator control the above-mentioned phenomenon?
A survey was conducted to find the number of hours that students
parameter.
spend viewing TV in a small town in a district in Ghana. The table below
shows the results.
5 - 8
9 – 12
13 – 16
17 – 20
No. of
1-4
Hours
No. of
7
12
15
9
7
Students (f)
i.
Estimate the Karle Pearson's Coefficient of Skewness and interpret
your results to the ordinary person.
What do you think may have informed the researchers idea of
presenting his data as tabulated above?
ii.
Expert Solution
This question has been solved!
Explore an expertly crafted, step-by-step solution for a thorough understanding of key concepts.

This is a popular solution!

Trending now
This is a popular solution!

Step by step
Solved in 2 steps with 2 images

Knowledge Booster


Learn more about
Need a deep-dive on the concept behind this application? Look no further. Learn more about this topic, statistics and related others by exploring similar questions and additional content below.Recommended textbooks for you
Glencoe Algebra 1, Student Edition, 9780079039897…
Algebra
ISBN:
9780079039897
Author:
Carter
Publisher:
McGraw Hill

College Algebra (MindTap Course List)
Algebra
ISBN:
9781305652231
Author:
R. David Gustafson, Jeff Hughes
Publisher:
Cengage Learning
Glencoe Algebra 1, Student Edition, 9780079039897…
Algebra
ISBN:
9780079039897
Author:
Carter
Publisher:
McGraw Hill
College Algebra (MindTap Course List)
Algebra
ISBN:
9781305652231
Author:
R. David Gustafson, Jeff Hughes
Publisher:
Cengage Learning