a. Based on the scatterplot, is there a positive or negative association between height of athlete and length of jump? b. Based on the scatterplot, state why using a linear regression equation is justified to assess the relationship between height and length of jump. c. Which of the following (pick one only) could be a possible value of the correlation coefficient between distance and height? Explain in a sentence or two. Choices are: -1, -0.7, 0, 0.1, 0.7, 1.
a. Based on the scatterplot, is there a positive or negative association between height of athlete and length of jump? b. Based on the scatterplot, state why using a linear regression equation is justified to assess the relationship between height and length of jump. c. Which of the following (pick one only) could be a possible value of the correlation coefficient between distance and height? Explain in a sentence or two. Choices are: -1, -0.7, 0, 0.1, 0.7, 1.

Glencoe Algebra 1, Student Edition, 9780079039897, 0079039898, 2018
18th Edition
ISBN:9780079039897
Author:Carter
Publisher:Carter
Chapter10: Statistics
Section10.6: Summarizing Categorical Data
Problem 25PPS

Related questions
Question
a. Based on the scatterplot , is there a positive or negative association between height of athlete and length of jump?
b. Based on the scatterplot, state why using a linear regression equation is justified to assess the relationship between height and length of jump.
c. Which of the following (pick one only) could be a possible value of the
between distance and height? Explain in a sentence or two.
Choices are: -1, -0.7, 0, 0.1, 0.7, 1.
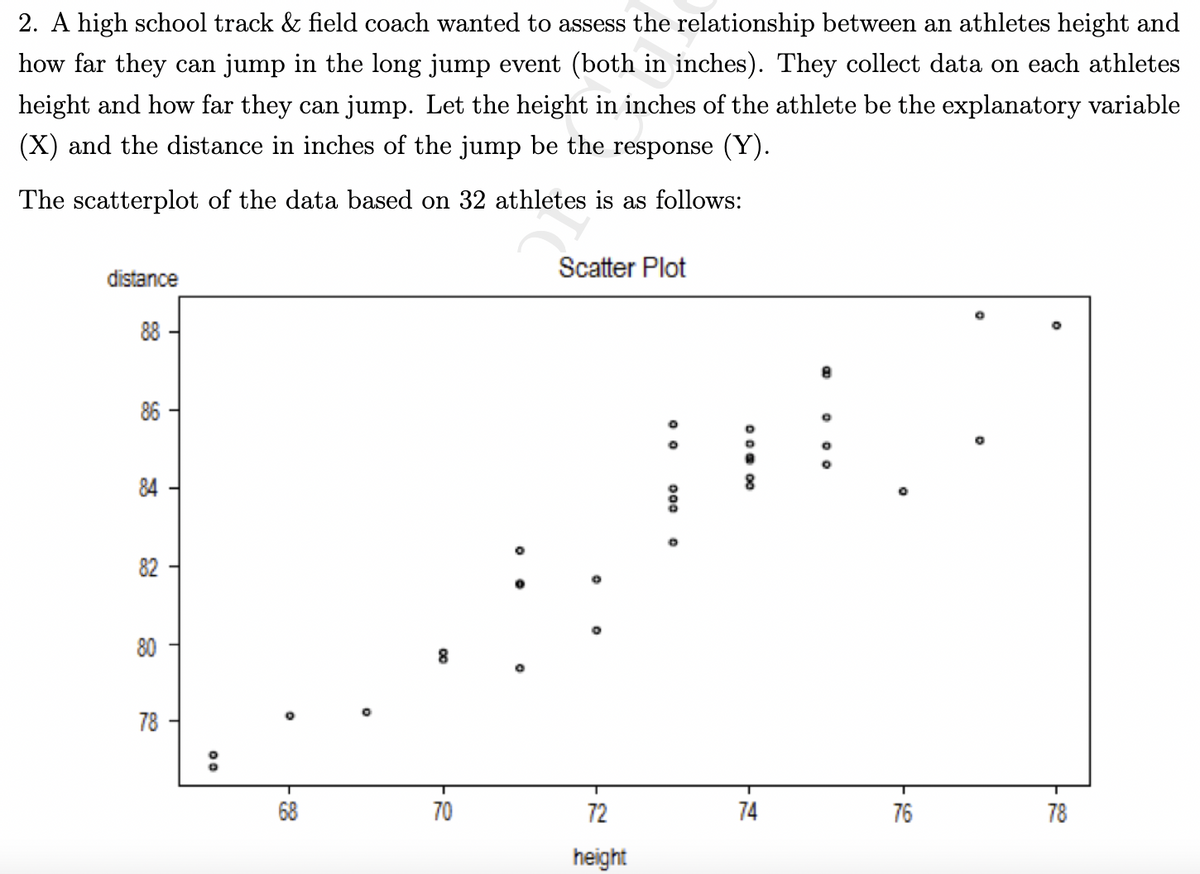
Transcribed Image Text:2. A high school track & field coach wanted to assess the relationship between an athletes height and
how far they can jump in the long jump event (both in inches). They collect data on each athletes
height and how far they can jump. Let the height in inches of the athlete be the explanatory variable
(X) and the distance in inches of the jump be the response (Y).
The scatterplot of the data based on 32 athletes is as follows:
distance
88
86
84
82
80
78
00
O
70
Scatter Plot
72
height
000
00 00
8
74
8
¥ 75
76
78
Expert Solution
This question has been solved!
Explore an expertly crafted, step-by-step solution for a thorough understanding of key concepts.

This is a popular solution!

Trending now
This is a popular solution!

Step by step
Solved in 4 steps

Recommended textbooks for you
Glencoe Algebra 1, Student Edition, 9780079039897…
Algebra
ISBN:
9780079039897
Author:
Carter
Publisher:
McGraw Hill
Glencoe Algebra 1, Student Edition, 9780079039897…
Algebra
ISBN:
9780079039897
Author:
Carter
Publisher:
McGraw Hill