In the context of the problem posed, interpret the results of the test at the 5% significance level and make a conclusion about the hypotheses.
In the context of the problem posed, interpret the results of the test at the 5% significance level and make a conclusion about the hypotheses.

Glencoe Algebra 1, Student Edition, 9780079039897, 0079039898, 2018
18th Edition
ISBN:9780079039897
Author:Carter
Publisher:Carter
Chapter10: Statistics
Section: Chapter Questions
Problem 25SGR

Related questions
Question
In the context of the problem posed, interpret the results of the test at the 5% significance level and make a conclusion about the hypotheses.
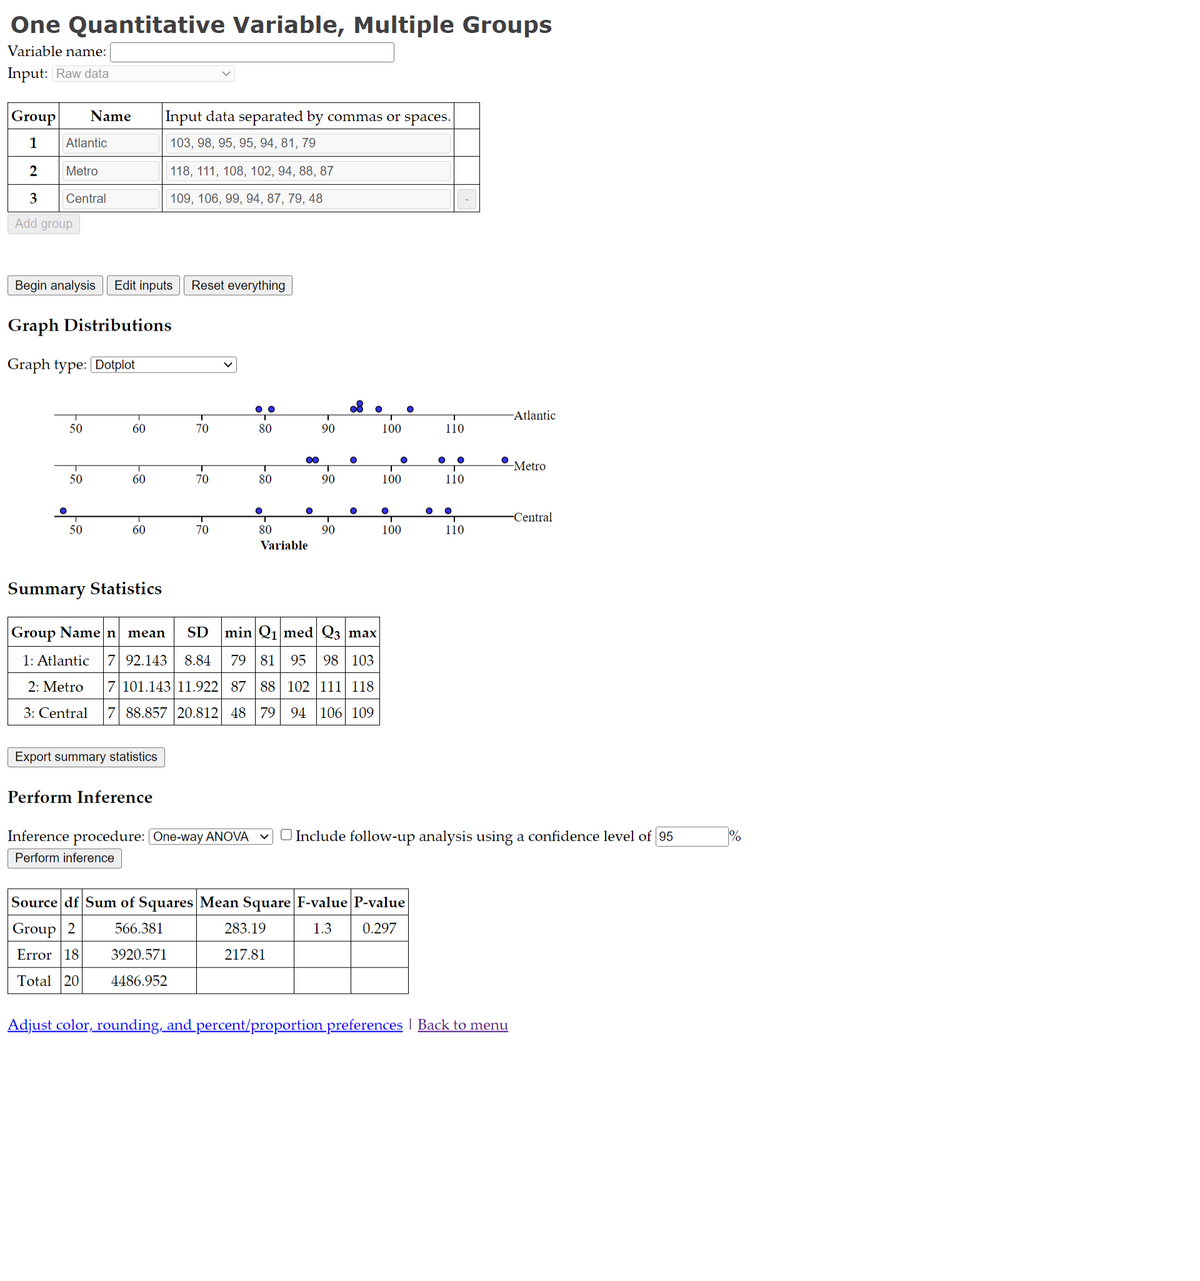
Transcribed Image Text:One Quantitative Variable, Multiple Groups
Variable name:
Input: Raw data
Group Name
1
2
3
Add group
Atlantic
Metro
Central
Begin analysis Edit inputs
Graph Distributions
Graph type: [Dotplot
O
50
50
50
60
60
60
Input data separated by commas or spaces.
103, 98, 95, 95, 94, 81, 79
118, 111, 108, 102, 94, 88, 87
109, 106, 99, 94, 87, 79, 48
Export summary statistics
Perform Inference
Reset everything
70
70
70
00
80
80
●
∞
●
80
Variable
90
283.19
217.81
90
Summary Statistics
Group Name n mean
SD min Q₁ med Q3 max
1: Atlantic 7 92.143 8.84 79 81 95 98 103
2: Metro
7 101.143 11.922 87 88 102 111 118
3: Central 7 88.857 20.812 48 79 94 106 109
90
●
100
●
100
O
100
Source df Sum of Squares Mean Square F-value P-value
Group 2
566.381
1.3 0.297
Error 18
3920.571
Total 20
4486.952
110
O
110
● O
110
-Atlantic
Inference procedure: [One-way ANOVA Include follow-up analysis using a confidence level of 95
Perform inference
-Metro
-Central
Adjust color, rounding, and percent/proportion preferences | Back to menu
Expert Solution
This question has been solved!
Explore an expertly crafted, step-by-step solution for a thorough understanding of key concepts.

Step by step
Solved in 3 steps with 4 images

Recommended textbooks for you
Glencoe Algebra 1, Student Edition, 9780079039897…
Algebra
ISBN:
9780079039897
Author:
Carter
Publisher:
McGraw Hill

Big Ideas Math A Bridge To Success Algebra 1: Stu…
Algebra
ISBN:
9781680331141
Author:
HOUGHTON MIFFLIN HARCOURT
Publisher:
Houghton Mifflin Harcourt
Glencoe Algebra 1, Student Edition, 9780079039897…
Algebra
ISBN:
9780079039897
Author:
Carter
Publisher:
McGraw Hill
Big Ideas Math A Bridge To Success Algebra 1: Stu…
Algebra
ISBN:
9781680331141
Author:
HOUGHTON MIFFLIN HARCOURT
Publisher:
Houghton Mifflin Harcourt