a. Compute MAD for the fifth period, then update it period by period using exponential smoothing with a = .10. (Round your intermediate calculations and final answers to 3 decimal places.)
a. Compute MAD for the fifth period, then update it period by period using exponential smoothing with a = .10. (Round your intermediate calculations and final answers to 3 decimal places.)

Contemporary Marketing
18th Edition
ISBN:9780357033777
Author:Louis E. Boone, David L. Kurtz
Publisher:Louis E. Boone, David L. Kurtz
Chapter14: Pricing Strategies
Section14.2: Forecasting Demand
Problem 1LO

Related questions
Question
Solve it both a
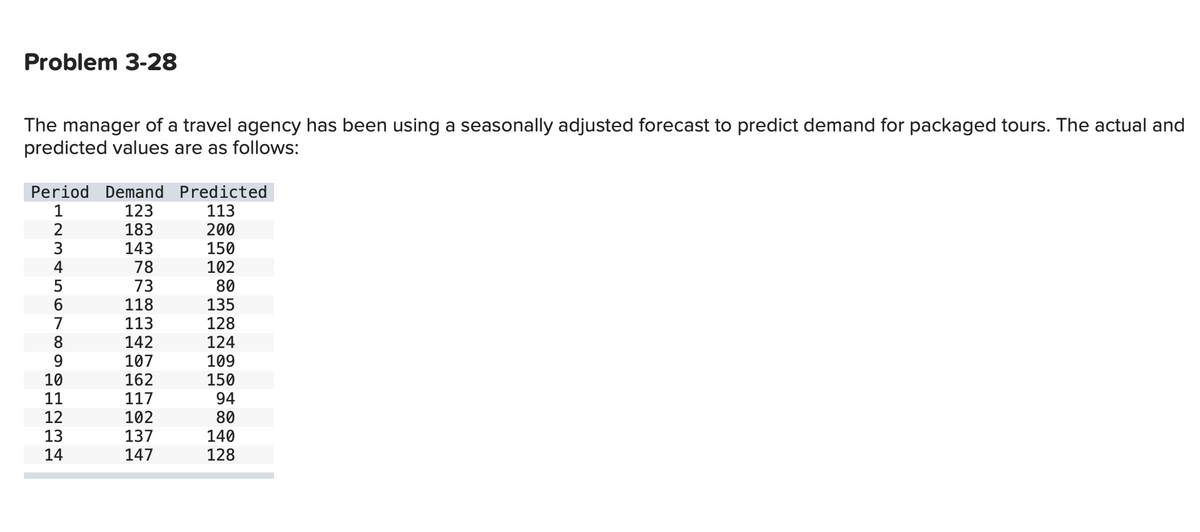
Transcribed Image Text:Problem 3-28
The manager of a travel agency has been using a seasonally adjusted forecast to predict demand for packaged tours. The actual and
predicted values are as follows:
Period Demand Predicted
123
183
113
200
1
143
78
73
150
102
80
135
4
5
6.
118
113
142
7
128
124
9.
107
162
117
109
150
94
80
10
11
102
137
12
13
140
128
14
147
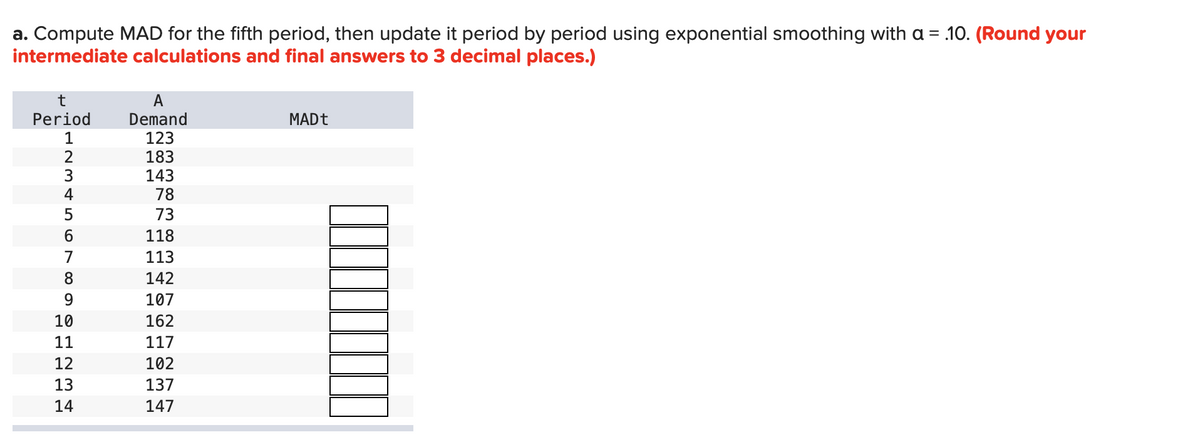
Transcribed Image Text:a. Compute MAD for the fifth period, then update it period by period using exponential smoothing with a = .10. (Round your
intermediate calculations and final answers to 3 decimal places.)
t
A
Period
Demand
123
183
143
78
MADT
1
3
4
73
6.
118
7
113
8.
142
9.
107
10
162
11
117
12
102
13
137
14
147
Expert Solution
This question has been solved!
Explore an expertly crafted, step-by-step solution for a thorough understanding of key concepts.

This is a popular solution!

Trending now
This is a popular solution!

Step by step
Solved in 2 steps

Knowledge Booster


Learn more about
Need a deep-dive on the concept behind this application? Look no further. Learn more about this topic, operations-management and related others by exploring similar questions and additional content below.Recommended textbooks for you
Contemporary Marketing
Marketing
ISBN:
9780357033777
Author:
Louis E. Boone, David L. Kurtz
Publisher:
Cengage Learning

Practical Management Science
Operations Management
ISBN:
9781337406659
Author:
WINSTON, Wayne L.
Publisher:
Cengage,

Marketing
Marketing
ISBN:
9780357033791
Author:
Pride, William M
Publisher:
South Western Educational Publishing
Contemporary Marketing
Marketing
ISBN:
9780357033777
Author:
Louis E. Boone, David L. Kurtz
Publisher:
Cengage Learning
Practical Management Science
Operations Management
ISBN:
9781337406659
Author:
WINSTON, Wayne L.
Publisher:
Cengage,
Marketing
Marketing
ISBN:
9780357033791
Author:
Pride, William M
Publisher:
South Western Educational Publishing