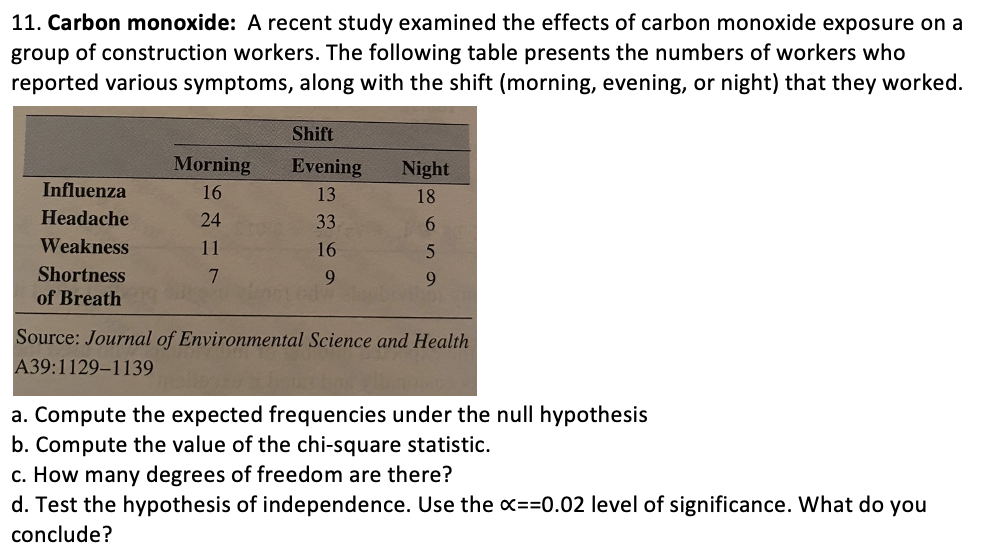
a. Compute the expected frequencies under the null hypothesis b. Compute the value of the chi-square statistic. c. How many degrees of freedom are there?


Q: Suppose the simple linear regression model, Y; = Bo + B1 x; + E;, is used to explain the…
A:
Q: you
A:
Q: phosphate mine workers who had 30-89 WLM of exposure, and 60 phosphate mine workers who had 90-120…
A: The question is about chi square test . Given :
Q: Dylan wants to determine a 99 percent confidence interval for the true proportion p of high school…
A:
Q: Seven out of a random sample of 150 individuals vaccinated with Astrazeneca reported that they have…
A: We find the 95/% confidence interval for difference between two Proportion.
Q: Five males with a particular genetic disorder have one child each. The random variable x is the…
A: Solution-: Let, X=the number of children among the five who inherit the genetic disorder. We have…
Q: n supplementary reading. He decides to do an experiment to evaluate the three options. He solicits…
A: By applying the ANOVA test for a single factor a) The Null and alternative hypothesis: Ho: µ1 =…
Q: Assume the weight of Koala bears is normally distributed with a mean of 21 lbs and a standard…
A:
Q: A random process is described by X(1) = A , where A is a continuous random variable uni formly…
A:
Q: Assume that females have pulse rates that are normally distributed with a mean of u= 72.0 beats per…
A: It is given that: μ (mean beat rate)=72σ (SD of beat rate)=12.5.
Q: Answer the 3 questions based on the graph
A: Stacked bar chart is useful when it comes to display and compare the different segments of a…
Q: Suppose from random sample of 500 teenagers, the mean number of sweaters owned was 12.5 and a…
A:
Q: The random error term represents the influences of all of the unobserved factors that are not…
A: The general form of the regression model is as shown below: Y=β0+β1X1+β2X2+...+βkXk+U Here U…
Q: 13. What is the Relative Risk for these data?
A: The given data set is, The formula for calculating the relative risk is,
Q: What type of variable is "monthly rainfall in Vancouver"? O A. quantitative B. categorical O C. none…
A:
Q: The ACT is a standardized test used by college admissions offices as a factor in whether an
A: 1. Georgia's score report said that her ACT Math score was in the 90th percentile. From the given…
Q: What is the critical value for a two-tailed test with a = 0.10 and n = 100? A +1.645 B +1.96 C +2.33…
A: It is given that level of significance, α=0.10 and n =100
Q: A university counselor believes that hypnosis is more effective than the standard treatment given to…
A: Given Information: Hypnosis Treatment Standard Treatment 20 42 21 35 33 30 40 53 24 57…
Q: In the Stat 201 Fall semester survey, 39 students reported having "Very Liberal" social political…
A: For the Oneway Analysis, given the JMP output: t ratio = 2.656721 DF = 69.59157
Q: 2) find "c" s.t P(S? < c) = 0.95 if X:n(u, 12),n = 6, X2 = 11.10. %3D
A:
Q: Suppose from random sample of 500 teenagers, the mean number of sweaters owned was 12.5 and a…
A: The following information has been provided. Sample size = 500 Sample standard deviation = 6.1…
Q: what is the test statistic
A:
Q: Directions: Illustrate the rejection region given the critical value and identify if the t-values…
A: From the given values
Q: A random sample of some of the heaviest carnivores on Earth was reviewed to determine if there is an…
A: Since we only do up to three sub parts of a problem, we'll be doing the first three subparts. Please…
Q: 'n each part, we have given the significance level and the P-value for a hypothesis test. For each…
A: We have given the following statement about the hypothesis test.
Q: From a pharmaceutical study, 18% of adults who take placebos suffered side effects and 82% did not…
A: reported side effects reported no side effects observed counts 51 274 Expected counts…
Q: Express the confidence interval 0.444<p<0.888 in the form p±E. Question content area bottom Part 1…
A: The random variable X follows normal distribution. We have to write the confidence interval in the…
Q: Use the given confidence level and sample data to find a confidence interval for the population…
A:
Q: Solve the given problem, Find z, z value (area), graph the normal curve and the n. 1. the…
A:
Q: . Given the following data set, calculate the appropriate capability statistics for this process…
A:
Q: Below are the ages of the starters on two soccer teams. FC Looneys: 26, 31, 29, 30, 30, 26, 26, 31,…
A: FC Looneys looks negatively skewd with outlier. Pooers Fc looks Symmetrical with No outliers.
Q: What is an outlier? O No answer text provided. O No answer text provided. O A number that is…
A:
Q: During the Lazhopee 11-11 event, it was observed that male users were shopping most often for mobile…
A: Here's, we know that there are 500 users.we will check independency between them. We will use…
Q: The mean can also be thought of as the
A: Given that Statement : The mean can also be thought of as the We know that Mean is the average…
Q: Consider two random variables, X and Y, such that Y =-4X +20. The mean value and the variance of X…
A: The correlation is the relationship between two variables. It can be measured using the correlation…
Q: The average entrance exam score of a random sample of 35 first year students of CSM was 89.66 with a…
A: Given, Sample size, n = 35 Mean, X = 89.66 Standard deviation, s = 18.28 Confidence interval = 96%…
Q: Activity1: Formulate the null and alternative hypotheses. Identify whether it is one-tailed or two…
A: Disclaimer: Since you have posted a question with multiple sub-parts, we will solve the first three…
Q: The table shows the height of the first eight students standing in line to get lunch from the…
A: Introduction: Mean Absolute deviation: The mean absolute deviation is the average of distance…
Q: An energy company wants to choose between two regions in a state to install energy-producing wind…
A:
Q: The Principal decided that the top 30% of the class with the highest grades in statistics will be…
A: Given that, μ=80.51σ=10.2 Consider that the top 30% of the class with the highest grades in…
Q: A license plate consists of two upper-case letters followed by three numbers. a) Find the number of…
A: Introduction: The number of possible license plates is to be obtained.
Q: standard deviation?
A: From the given data, the minimum and maximum values are, 20.5 and 110.7 The range is, The mean is,
Q: Given H u> 85 and P-0.003. What decision should be made at the 0.01 level of significance?
A: Given: P=0.003 α=0.01
Q: mple is rder to be 99% confident that the sample proportion will not differ from the true proportion…
A: Given : Margin of error: ME = 0.06 sample proportion: p̂ = 0.23
Q: 9. Find the quartile and median as well as coefficient of skewness from the following figures :…
A:
Q: 1. Given data: Class interval f M cf< 69 - 71 9 70 88 66 - 68 4 67 79 63 - 65 7 64 75 60 - 62 61 68…
A: The objective is to identify the width of interval, median and modal class and evaluate the values…
Q: 4. (a) Explain how a decision function relates to a rejection region.
A: Given information: Decision rule or the decision function is formulated for the circumstances where…
Q: Flip a coin three times Construct the sample space Use it to find the probability of at most one (1)…
A: Since you have asked multiple questions, we will solve the first question for you. If you want any…
Q: The diameter of a brand of tennis balls is approximately normally distributed, with a mean of 2.63…
A: Given that, μ=2.63,σ=0.03,n=9 The mean of sampling distribution of sample mean is, (a) The standard…

Step by step
Solved in 2 steps

- A sociologist wants to investigate the question, "Is there a relationship between texting during class and grade-point-average (GPA) among high school seniors in a large district?" Which study design is most appropriate? Before the semester starts, randomly select 40 seniors from each high school who do not text during class. Assign 20 to the texting treatment group (text three or more times during every class meeting) and 20 to the control group (no texting during class). At the end of the semester, obtain each student’s GPA from the appropriate admissions and records office. Compare the GPA of students who routinely text during class to the GPA of students who do not text during class. Before the semester starts, randomly select 40 seniors from each high school who do not text during class. Assign 20 to the texting treatment group (text three or more times during every class meeting) and 20 to the control group (no texting during class). At the end of the semester,…Wertheretal et al. examined the β-leucocyte count (/ L) in 51subjects with colorectal cancer and 19 healthy controls. The cancer patients were also classified into Dukes’s classification (A,B,C) for colorectal cancer that gives doctors a guide to the risk, following surgery, of cancer coming back or spreading to other parts of the body. An additional category (D) identified patients with disease that had not been completely resected. The results are displayed in the following table. Perform an analysis of these data in which you identify the sources of variability and specify the degrees of freedom for each. Do these data provide sufficient evidence to indicate that, on average, leucocyte counts differ among the five categories? Let α=0.01 . Write the null and alternative hypotheses of this study. Test the claim using the ANOVA Table. If you reject the null hypothesis, interpret your results using multiple comparison test Bonferroni. What assumptions must be made in part (b)? Are they…Chocolate contains caffeine and an endogenous cannabinoid, as well as a chemical thatmodulates serotonin production; but is it an aphrodisiac, as the Mayans and Aztecs believed?Suppose you conduct a study which measures sex drive in a group of 20 women, after eating 8ounces of chocolate. Given that you have available data from the Kinsey Institute (IndianaUniversity) about the general sex drive for women of the same demographic as in your study, youdecide to compare your group to this population estimate.If testing hypotheses about the effects of chocolate on sex drive, it would be most appropriate tocalculate a ...1)Paired sampled t2)Z-test3)Independent-samples t-test 4)One- sample t-test
- Consider a proposed case-control study of autism spectrum disorder (ASD) and maternal boba tea consumption in Irvine. Assume that 20% of Irvine mothers are regular consumers (at least 3 servings per week) of boba tea, and that the prevalence of ASD is 1/59 (making it a somewhat rare disease). Also assume that 50% of Irvine mothers who regularly consume boba tea prefer black milk tea, that the prevalence of regular boba tea consumption among mothers of autistic children is 25%, that each participant will be paid $30 to join the study, and that there are at least 1,000 mothers of autistic children and at least 100,000 mothers of non-autistic children in Irvine who are willing to participate in the study if compensated. If these assumptions are correct, what is the odds ratio describing the association between regular boba tea consumption and ASD? HINT: Recall that the disease odds ratio is equal to the exposure odds ratio.Suppose that 80% of 3–4-year-old children and 70% of5–8-year-old children in a village are vaccinated with QIVvaccine. Also assume that children who are not vaccinatedhave twice the incidence of influenza as the control groupin Table 3.7.3.29 What % of 3–4-year-old children in the village will getinfluenza?3.30 What % of 5–8-year-old children in the village will getinfluenza?3.31 Suppose we identify a 5–8-year-old child with influenzain the village but are uncertain whether the childwas vaccinated. If we make the same assumptions as inProblems 3.29–3.30, then what is the probability that thechild was vaccinated? (Hint: Use Bayes’ rule here.)Iron is an essential nutrient. Iron deficiency has beenlinked with symptoms such as anemia, rapid heartbeat,increased risk of infections, and lightheadedness. At theother end of the spectrum is iron overload, describedin an August 2012 New York Times article. Excess ironis deposited in the liver, heart, and pancreas and cancause cirrhosis, liver cancer, cardiac arrhythmias, anddiabetes. According to a Framingham Heart Studyresearcher, “About one person in 250 inherits a geneticdisorder called hemochromatosis that increases ironabsorption and results in a gradual, organ-damagingbuildup of stored iron.” Suppose we have a random sample of 1000 adults, and want to find the probabil-ity that at least 5 of them have this disorder. Which of these statements is true? I. We would expect 4 of these people to have hemo-chromatosis. II. We can calculate this probability using a Binomialmodel.III. We can approximate this probability using a Normalmodel.A) None B) I only C) I and II onlyD) I and III…
- Do well-rounded people get fewer colds? A study on the Chronicle of Higher Education was conducted by scientist at Carnegie Mellon University, the University of Pittsburgh and the University of Virginia. They found that people who have only a few social outlets get more colds than those who are involved in a variety of social activities. Suppose that of the 276 healthy men and women tested, n1=96 had only a few social outlets and n2=105 were busy with six or more activities. When these people were exposed to a cold virus, the following results were observed: Construct a 99% confidence interval for the difference in the two population proportions.15) Consumer Research, Inc., is an independent agency that conducts research on consumer attitudes and behaviors for a variety of firms. In one study, a client asked for an investigation of consumer characteristics that can be used to predict the amount charged by credit card users. Data were collected on annual income, household size, and annual credit card charges for a sample of 50 consumers. Prepare a managerial report that summarizes findings of an investigation of consumer characteristics that can be used to predict the amount charged by credit card users including annual income, household size, and annual credit card. Consider the complete data set. Income($1,000s) HouseholdSize AmountCharged($) 54 3 4,006 30 2 3,169 32 4 5,090 50 5 4,732 31 2 1,854 55 2 4,080 37 1 2,721 40 2 3,358 66 4 4,754 51 3 4,120 25 3 4,198 48 4 4,209 27 1 2,487 33 2 2,524 65 3 4,224 63 4 4,975 42 6 4,422 21 2 2,438 44 1 2,985 37 5 4,161 62 6 5,688 21 3 3,613…According to the February 2008 Federal Trade Commission report on consumerfraud and identity theft, 23% of all complaints in 2007 were for identity theft. Inthat year, Arkansas had 1,601 complaints of identity theft out of 3,482 consumercomplaints ("Consumer fraud and," 2008). Does this data provide enoughevidence to show that Arkansas had a higher proportion of identity theft than23%? Test at the 5% level.
- The technology underlying hip replacements has changed as these operations havebecome more popular (over 250,000 in the United States in 2008). Starting in 2003,highly durable ceramic hips were marketed. Unfortunately, for too many patients theincreased durability has been counterbalanced by an increased incidence ofsqueaking. The May 11, 2008, issue of the New York Times reported that in one studyof 143 individuals who received ceramic hips between 2003 and 2005, 10 of the hipsdeveloped squeaking.a. Calculate a lower confidence bound at the 95% confidence level for the trueproportion of such hips that develop squeaking.b. Interpret the 95% confidence level used in (a).A paper in the Journal of Nervous and Mental Disorders reported the following data on the amount of dextroamphetamine excreted by a sample of children having organically related disorders and a sample of children with nonorganic disorders (dextroamphetamine is a drug commonly used to treat hyperkinetic children). Organic: 17.53, 20.60, 17.62, 28.93, 27.10 Nonorganic: 15.59, 14.76, 13.32, 12.45, 12.79 (Observations refer to percentage of recovery of the drug seven hours after its administration.) If we assume that the variances of the two groups of children are unequal, determine whether the true average percentages of recovery for the two conditions are equal at significance level 0.01Eighteen percent of U.S.-based multinational companies provide an allowance for personal long-distance calls for executives living overseas, according to the Institute for International Human Resources and the National Foreign Trade Council. Suppose a researcher thinks that U.S.-based multinational companies are having a more difficult time recruiting executives to live overseas and that an increasing number of these companies are providing an allowance for personal long-distance calls to these executives to ease the burden of living away from home. To test this hypothesis, a new study is conducted by contacting 376 multinational companies. Twenty-two percent of these surveyed companies are providing an allowance for personal long-distance calls to executives living overseas. Does the test show enough evidence to declare that a significantly higher proportion of multinational companies provide a long-distance call allowance? Let α = .01.