a. Construct a scatterplot of the data, with number of strikes on the y-axis and age of the fish on the x-axis. b. Examine the scatterplot of part a. Do you detect a trend?
a. Construct a scatterplot of the data, with number of strikes on the y-axis and age of the fish on the x-axis. b. Examine the scatterplot of part a. Do you detect a trend?

Holt Mcdougal Larson Pre-algebra: Student Edition 2012
1st Edition
ISBN:9780547587776
Author:HOLT MCDOUGAL
Publisher:HOLT MCDOUGAL
Chapter11: Data Analysis And Probability
Section: Chapter Questions
Problem 8CR

Related questions

Question
Please answer all parts
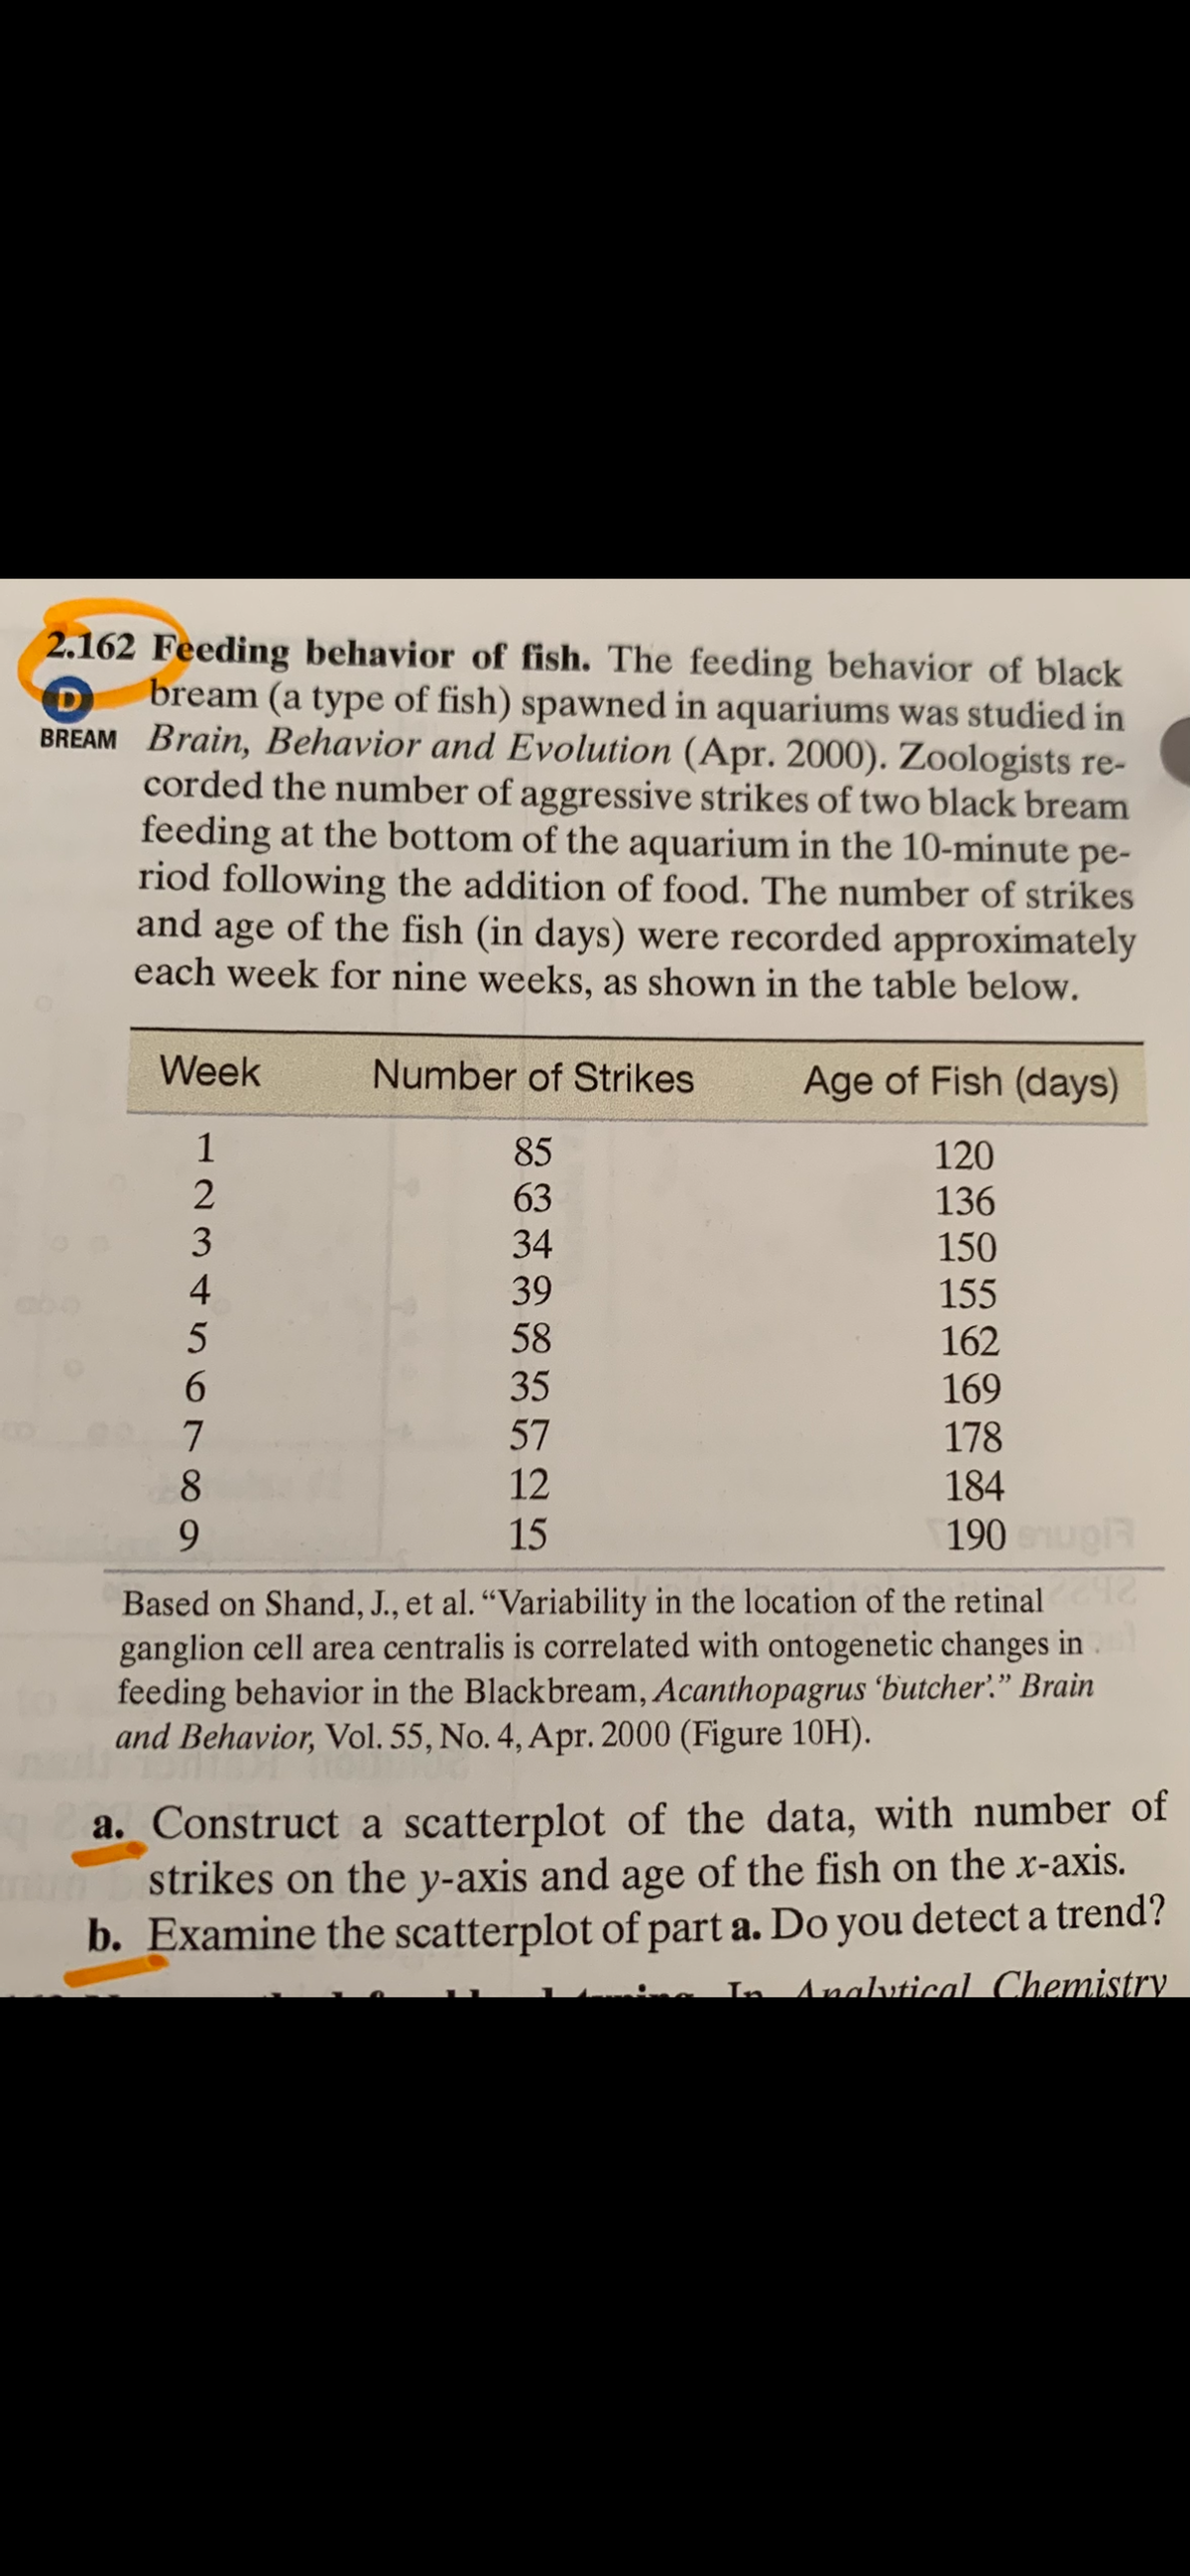
Transcribed Image Text:2.162 Feeding behavior of fish. The feeding behavior of black
bream (a type of fish) spawned in aquariums was studied in
BREAM Brain, Behavior and Evolution (Apr. 2000). Zoologists re-
corded the number of aggressive strikes of two black bream
feeding at the bottom of the aquarium in the 10-minute pe-
riod following the addition of food. The number of strikes
and age of the fish (in days) were recorded approximately
each week for nine weeks, as shown in the table below.
Week
Number of Strikes
Age of Fish (days)
85
120
63
136
34
150
abo
39
155
58
162
35
169
57
178
8
12
184
9.
15
190 ugR
Based on Shand, J., et al. "Variability in the location of the retinal
ganglion cell area centralis is correlated with ontogenetic changes in .
feeding behavior in the Blackbream, Acanthopagrus 'butcher'." Brain
and Behavior, Vol. 55, No. 4, Apr. 2000 (Figure 10H).
a. Construct a scatterplot of the data, with number of
strikes on the y-axis and age of the fish on the x-axis.
b. Examine the scatterplot of part a. Do you detect a trend?
In Analutical. Chemistry
1234 n670
Expert Solution
This question has been solved!
Explore an expertly crafted, step-by-step solution for a thorough understanding of key concepts.

This is a popular solution!

Trending now
This is a popular solution!

Step by step
Solved in 2 steps with 1 images

Knowledge Booster


Learn more about
Need a deep-dive on the concept behind this application? Look no further. Learn more about this topic, statistics and related others by exploring similar questions and additional content below.Recommended textbooks for you
Holt Mcdougal Larson Pre-algebra: Student Edition…
Algebra
ISBN:
9780547587776
Author:
HOLT MCDOUGAL
Publisher:
HOLT MCDOUGAL
Holt Mcdougal Larson Pre-algebra: Student Edition…
Algebra
ISBN:
9780547587776
Author:
HOLT MCDOUGAL
Publisher:
HOLT MCDOUGAL