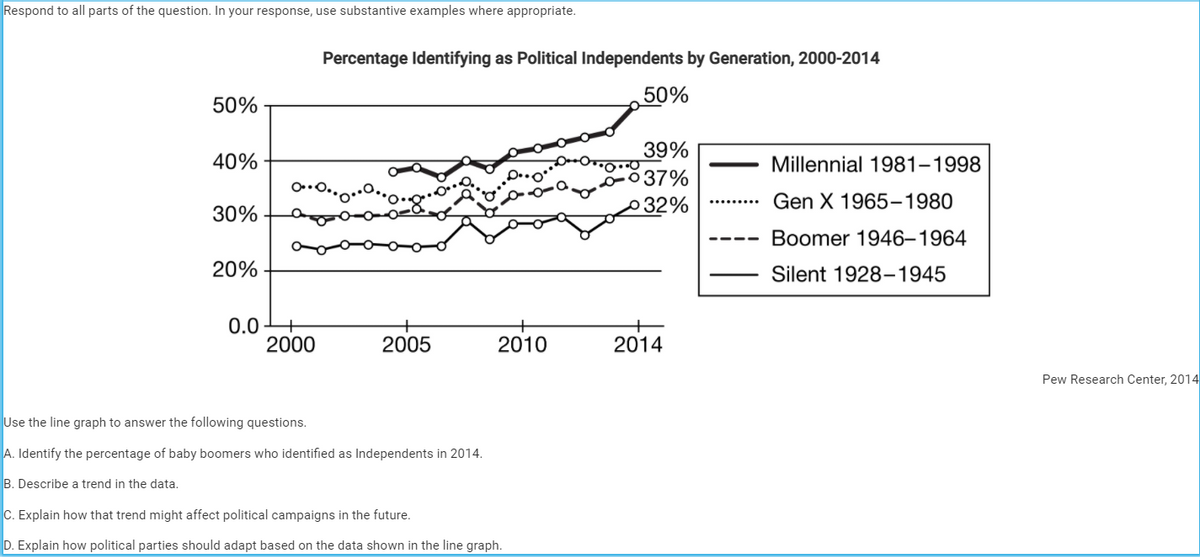
Respond to all parts of the question. In your response, use substantive examples where appropriate. Percentage Identifying as Political Independents by Generation, 2000-2014 50% 50% 39% 37% о32% 40% Millennial 1981–1998 Gen X 1965–1980 30% Boomer 1946–1964 ---- 20% Silent 1928–1945 0.0+ 2000 2005 2010 2014 Pew Resear Use the line graph to answer the following questions. A. Identify the percentage of baby boomers who identified as Independents in 2014. B. Describe a trend in the data. C. Explain how that trend might affect political campaigns in the future. D. Explain how political parties should adapt based on the data shown in the line graph.


Inverse Normal Distribution
The method used for finding the corresponding z-critical value in a normal distribution using the known probability is said to be an inverse normal distribution. The inverse normal distribution is a continuous probability distribution with a family of two parameters.
Mean, Median, Mode
It is a descriptive summary of a data set. It can be defined by using some of the measures. The central tendencies do not provide information regarding individual data from the dataset. However, they give a summary of the data set. The central tendency or measure of central tendency is a central or typical value for a probability distribution.
Z-Scores
A z-score is a unit of measurement used in statistics to describe the position of a raw score in terms of its distance from the mean, measured with reference to standard deviation from the mean. Z-scores are useful in statistics because they allow comparison between two scores that belong to different normal distributions.
I need help figuring out this practice question. It is not for a grade but for my own knowledge


Trending now
This is a popular solution!

Step by step
Solved in 2 steps


