а. Construct an FDT for the data using five class intervals b. What the table tells you, what can you suggest to the owner?
а. Construct an FDT for the data using five class intervals b. What the table tells you, what can you suggest to the owner?

Glencoe Algebra 1, Student Edition, 9780079039897, 0079039898, 2018
18th Edition
ISBN:9780079039897
Author:Carter
Publisher:Carter
Chapter10: Statistics
Section10.6: Summarizing Categorical Data
Problem 4DGP

Related questions
Question
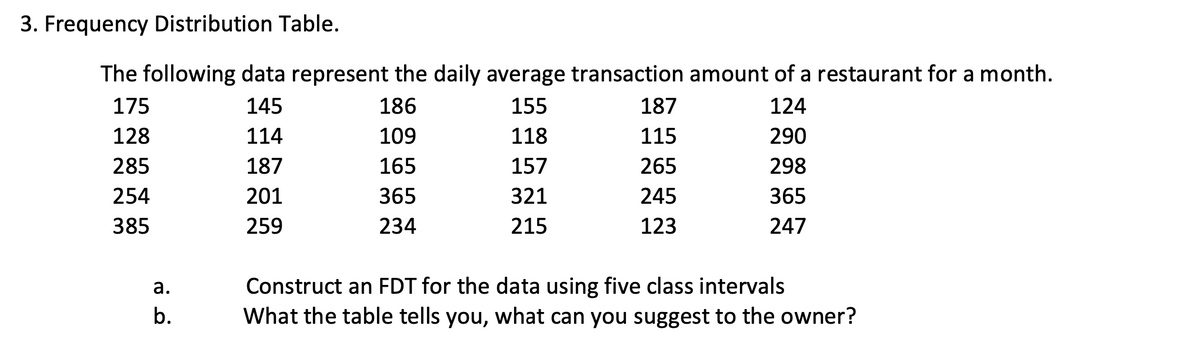
Transcribed Image Text:3. Frequency Distribution Table.
The following data represent the daily average transaction amount of a restaurant for a month.
175
145
186
155
187
124
128
114
109
118
115
290
285
187
165
157
265
298
254
201
365
321
245
365
385
259
234
215
123
247
а.
Construct an FDT for the data using five class intervals
b.
What the table tells you, what can you suggest to the owner?
Expert Solution
This question has been solved!
Explore an expertly crafted, step-by-step solution for a thorough understanding of key concepts.

Step by step
Solved in 2 steps with 2 images

Recommended textbooks for you
Glencoe Algebra 1, Student Edition, 9780079039897…
Algebra
ISBN:
9780079039897
Author:
Carter
Publisher:
McGraw Hill
Glencoe Algebra 1, Student Edition, 9780079039897…
Algebra
ISBN:
9780079039897
Author:
Carter
Publisher:
McGraw Hill