Which of the following is not a Reliability Index O a. FOR O b. LOLP O c. LOEP O d. Reserve Margin
Which of the following is not a Reliability Index O a. FOR O b. LOLP O c. LOEP O d. Reserve Margin

Glencoe Algebra 1, Student Edition, 9780079039897, 0079039898, 2018
18th Edition
ISBN:9780079039897
Author:Carter
Publisher:Carter
Chapter10: Statistics
Section10.5: Comparing Sets Of Data
Problem 14PPS

Related questions
Question
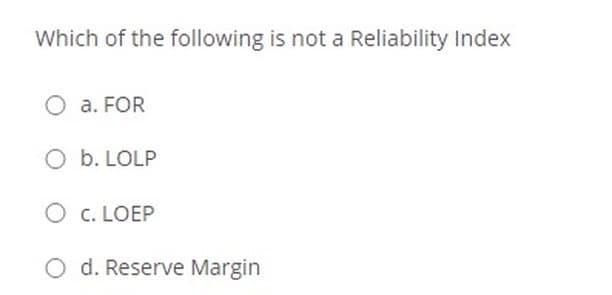
Transcribed Image Text:Which of the following is not a Reliability Index
O a. FOR
O b. LOLP
O c. LOEP
O d. Reserve Margin
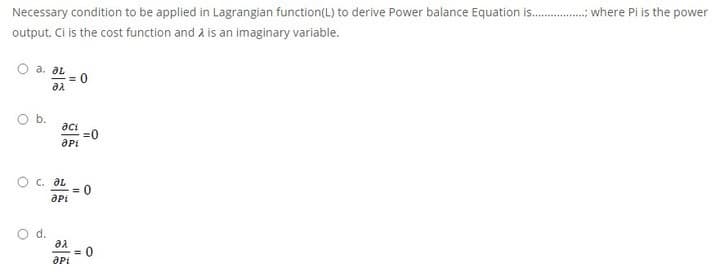
Transcribed Image Text:Necessary condition to be applied in Lagrangian function(L) to derive Power balance Equation is.
. where Pi is the power
output, Ci is the cost function and à is an imaginary variable.
a. al
= 0
Ob.
aci
=0
aPi
O c. aL
= 0
d.
aa
= 0
aPi
Expert Solution
This question has been solved!
Explore an expertly crafted, step-by-step solution for a thorough understanding of key concepts.

Step by step
Solved in 2 steps

Knowledge Booster


Learn more about
Need a deep-dive on the concept behind this application? Look no further. Learn more about this topic, statistics and related others by exploring similar questions and additional content below.Recommended textbooks for you
Glencoe Algebra 1, Student Edition, 9780079039897…
Algebra
ISBN:
9780079039897
Author:
Carter
Publisher:
McGraw Hill
Glencoe Algebra 1, Student Edition, 9780079039897…
Algebra
ISBN:
9780079039897
Author:
Carter
Publisher:
McGraw Hill