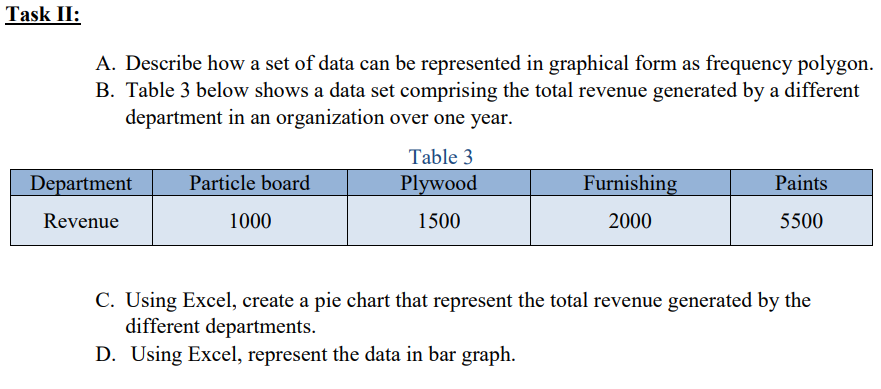
A. Describe how a set of data can be represented in graphical form as frequency polygon. B. Table 3 below shows a data set comprising the total revenue generated by a different department in an organization over one year. Table 3 Department Particle board Plywood Furnishing Paints Revenue 1000 1500 2000 5500


Q: 1. Complete the following table and answer the questions below: Units consumed Total utility Margina...
A: "According to the guidelines, solution is given to the first question." 1. "Total utility refers to ...
Q: In the hypothetical economy, the AD curve and SAS curve are given by the following equations: AD: Y=...
A: Given Functions Aggregate demand function Y=560-20P+3G Aggregate supply function Y=8+5P-3P(oil)
Q: Suppose profits are less than zero. From this it follows that: Group of answer choices A.aggregate...
A: Profit formula: Profit = Total Revenue - Total Cost
Q: You work for the only car rental company at an airport renting identical mid-size cars. They want to...
A: Price discrimination is a marketing approach in which a vendor charges varying prices for the same p...
Q: Modern economics growth was made possible by
A: The definition's three components are all critical. Economic growth can be characterised as a long-t...
Q: * 20. In a closed economy without investment and government spending, C = 1000 + .5YD, and taxes T=5...
A: Given C = 1000 + 0.5Yd Taxes = 50 As economy has no investment and government spending the level of ...
Q: Mavi and Diesel both make basic blue jeans. The demand curves for the two firms are given by Qm=135...
A: Marginal cost is the ratio of change in total cost to the change in output. The marginal cost is the...
Q: The goal of health insurance is to O spread financial risk over a large group of people O equally di...
A: Health insurance covers all the medical treatment costs for the people.
Q: The price and quantity data for Year 1 and Year 2 are as follows: Bread Butter Year 1 Quantity 50 10...
A: Real GDP = when the good of a year evaluated at base year prices.
Q: Explain in a critical way the effects of supply and demand on seasonal agricultural products (strawb...
A: According to the principles of a market economy, supply and demand together determine the prices and...
Q: An equipment cost P60,000 today and its salvage value is P20,000 after 6 years. Calculate its book v...
A: Given: Equipment cost=P 60000 Salvage value=P 20000 Life of asset=6 years
Q: We have study the Liquidity Preference Theory. Discuss the import points that are against this theor...
A: Answer: The criticism of the Liquidity Preference Theory is as under: To begin, it's vital to unders...
Q: Given: an inverse demand equation of P = 50 - 0.5Q, inverse supply equation of P = 0.333Q, a. W...
A: Inverse demand function, when price changes due to change in quantity demanded. Inverse supply funct...
Q: ABC
A: The Consumer Price Index (CPI) is a measure of an economy's overall price level. The CPI is made up ...
Q: The industrial revolution gave rise to capitalism and consumerism - True or False
A: Since you have asked multiple question, we will solve the first question for you. If you want any sp...
Q: Consider a game between 2 payers (Ann and Bill) where each chooses between 3 actions (Up, Middle and...
A: For the following game : Number of players - Ann & Bill Strategy set of Ann = Strategy set of B...
Q: There is evidence that income per worker is converging in A) the richest countries and the poorest c...
A: The measure of the amount of income that is being earned per person in a geographic region or nation...
Q: Determine the exact and ordinary simple interests on ₱2400 for the period from February 14 to Octobe...
A: Here the time period is given from February 14 to October 26, 2022 and it is not the leap year due t...
Q: VARIABLE COSTS OF PRODUCTION UNDER THEORY OF COMPARATIVE COSTS, COMMENT ON THE GRAHAM'S VIEW?
A: Answer: Graham refutes the generally held belief that specialisation will increase trade countries' ...
Q: 1. If demand is equally elastic, and price increases from 5 to 7, what is the total change? If price...
A: A change in price would increase the total revenue or decrease the total revenue depends on the pric...
Q: Consider public policy aimed at alcohol consumption. a) Studies indicate that the price elastici...
A: Since we only answer up to 3 sub-parts, we’ll answer the first 3. Please resubmit the question and s...
Q: Barron Chemical uses a thermoplastic polymer to enhance the appearance of certain RV panels. The ini...
A: Over a given period, an investment's return on investment (RoR) is calculated as a percentage of the...
Q: Suppose that Lizzo's utility function U is given by U = w.53, where w is wealth. Lizzo has wealth of...
A: Disclaimer: Since you have posted a multi-part question, I am providing you with the answer to the f...
Q: Table linking output to inputs Units of Labor Input Quantity of Output Marginal Product Marginal Cos...
A: Marginal product is the additional product gained when one more unit of variable factor is employed....
Q: What is Grievance ?
A: A grievance is an expression of an employee's dissatisfaction with their employment and its nature. ...
Q: Suppose a monopoly sells its goods in two different markets with demand curves Q1 = 150 – PĮ and Q2 ...
A: The long-run is a period in which the inputs remain variable except labor. It means the inputs remai...
Q: The firm considers whether the transaction and its tax implications is aligned with the objectives o...
A: Strategy, Anticipation, Value-adding, Negotiating, and Transforming are all acronyms for SAVANT. Man...
Q: discuss
A: *Answer: Privatization describes the process by which a piece of property or business goes from bei...
Q: A four-year lease agreement requires payments of $10,000 at the beginning of every year. If the inte...
A: When compounding effects are considered, the real return on a savings account or other interest-payi...
Q: Private firms that accept deposits and extend loans are known as a) mutual funds. b) banks. Oc) secu...
A: Mutual funds is that types of funds in which investors invest in many type of Assets, in generally...
Q: Economic theories about growth a) are mainly used for teaching. O b) have had no influence on govern...
A: Economic theory is a theory that simplifies the reality of an economy to make predictions about the ...
Q: A chemical plant worth P 110M has an estimated life of 6 years and a projected scrap value of P 10M....
A: Given; Worth of chemical plant= P110M Estimated life= 6years Scrap value = P10M Cost of new plant= P...
Q: O a) exogenous. O b) unsustainable. Oc) endogenous. d) random. e) based on luck.
A: Economic factors are the crucial information about the market and economy thought about when a ventu...
Q: How did the COVID-19 pandemic affect the economic, social, and political aspect of the Transportatio...
A: Introduction Covid - 19 pandemic affects not only Philippines economy but it affects every economy v...
Q: Part 1 - What kinds of specific actions has the IMF taken in order to address economic or financial ...
A: Since you have asked multiple question, we will solve the first question for you. If you want any sp...
Q: An example of physical capital is a) an educated worker. O b) fertile farmland. Oc) international tr...
A: Physical capital is the stock of equipment and structures that are used to produce goods and servic...
Q: Interest represents a) a cost to lenders and a reward to borrowers. b) the optimal rate of investmen...
A: Answer: Interest: Interest is the amount that is paid to savers of funds and the cost for the borrow...
Q: Define mixed strategy. Why would a firm use a mixed strategyinstead of a simple pure strategy?
A: Meaning of Decision Theory under Nash Equilibrium: The term decision theory refers to the situatio...
Q: Consider the following game Gn, known as the Traveler's Dilemma(Basu, 1994). Two business executives...
A: Since the question you have posted consists of multiple parts, we will answer the first two parts fo...
Q: what is the 4 factor that affects the level of interest rate? and how does each one work?
A: The cost of lending money is represented by an interest rate. On the other hand, it is a reward for ...
Q: To affect the level of potential output, the monetary policy and fiscal policy must alter short-run ...
A: Monetary policy is the monetary authority of the economy which manages the interest rate and short t...
Q: hat if the Global Initiative for Mental Health is not achieved?
A: To become developed, the country needs to have a healthy population. A healthy population will engag...
Q: MODIFIED TRUE or FALSE. Write "T" if the given statement is TRUE, correct and valid. Write "F", if o...
A: Perfectly competitive market: In a perfectly competitive market there are a large number of buyers a...
Q: if y=10k0.5 and current k is 100, depreciation is 10%, population growth is 2%, then for income per ...
A: Depreciation rate (d) = 10% Population growth rate (n) = 2% Let's assume saving rate is 's' --------...
Q: The government of Osris believes in balancing its budget over a seven-year cycle. Over the first six...
A: Given that the tax rate is 0.25, we will have the following table:
Q: respond to changes in another? Why would a profit-maximizing firm expand the use of each input unti...
A: DISCLAIMER “Since you have asked multiple question, we will solve the first question for you. If yo...
Q: You are the CEO of British Petroleum (BP), one of the world’s largest oil companies. You are looking...
A: Potential hazard is basically a threat to one's health or safety that may arise if preventative meas...
Q: 3. Among the exogenous variable, which will make your IS curve shift to left? 1.2 0.8 0.6 0.4 0.2 40...
A: IS curve shows goods market equilibrium and LM curve shows money market equilibrium . IS LM curve s...
Q: Humanity is faced with a tough choice, work or leisure. Within the theory of consumer behaviour, app...
A: When the budget line intersects the indifference curve, consumer optimization happens. On the same i...
Q: 1. If demand is equally elastic, and price increases from 5 to 7, what is the total change? If price...
A: Demand refers to the inverse relationship between the price and quantity demanded. The rise in price...

Step by step
Solved in 3 steps with 2 images


- Task II:Your manager asked you to answer the following:A) Define quantitative and qualitative data.B) Mention the differences between quantitative and qualitative data.C) Provide Real-World one example with Quantitative Data that could be presentedas a histogram (The example should contain the data collected + draw the frequency table for bothexamples).D) Provide Real-World one example with Qualitative Data that could be presented as a bar graph.(The example should contain the data collected + draw the frequency table for bothexamples). E) Use Excel software to represent the data in parts C and D.As part of its bankruptcy restructuring, General Motors (GM) launched an ad campaign that revealed glimmers of a streamlined GM: fewer brands (Cadillac, Buick, Chevrolet, GMC) and fewer models within each brand A. What research would you have done to determine which vehicle models GM should retain and which it should drop? B. What would you have measured and with what type of measurement scale?Data 1:*2008 and 2013 National Demographic Health Survey showed that the percentage of womenage 15- 19 who had a live birth or is pregnant with first child had increased from 9.9% - 10.1% inthe country.*In Region 1, the percentage of women age fifteen 15 - 24 who havebegun childbearing also increased from 26% - 29%. This was attributed to the following riskybehaviors identified by the adolescents during the Regional Adolescent Congress: Early sex,Substance abuse, Pornography, VAWC (rape case), Fraternities (bad gangs) & Prostitution. Questions:1. What is the impact of the given data to mortality and morbidity rate of adolescent population? 2. What is the impact of the given data to mortality and morbidity rate of neonatal population? 3. Give at least 3 social determinants of health which are contributory factors leading to the datapresented and justify..
- 1. Eastman Publishing Company is considering publishing an electronic textbook about spreadsheet applications for business. The fixed cost of manuscript preparation, textbook design, and web site construction is estimated to be $160,000. Variable processing costs are estimated to be $6 per book. The publisher plans to sell single-user access to the book for $46. a. Build a spreadsheet model to calculate the profit/loss for a given demand. What profit can be anticipated with a demand of 3,500 copies?b. Use a data table to vary demand from 1,000 to 6,000 in increments of 200 to assess the sensitivity of profit to demand.c. Use Goal Seek to determine the access price per copy that the publisher must charge to break even with a demand of 3,500 copies. d. Consider the following scenarios: Scenario 1 Scenario 2 Scenario 3 Scenario 4 Scenario 5 Variable Cost/Book $6 $8 $12 $10 $11 Access Price $46 $50 $40 $50 $60 Demand 2,500 1,000 6,000 5,000 2,000 For each of these scenarios,…The question wasnt answered fully- Show the necessary graphs to fully explain all requested effects. label graphs andgive brief explanations.Only typed answer and please don't use chatgpt otherwise I downvote the answer Assume that the relationship between test scores and the student-teacher ratio can be modeled as a linear function with an intercept of 698.9 and a slope of (-2.28). A decrease in the student teacher ratio by 2 will: A) reduce test scores by 2.28 on average B) result in a test score of 698.9 C) reduce test scores by 2.56 on average D) reduce test scores by 4.56 for every school district PLEASE EXPLAIN WHY C IS CORRECT.
- Construct the chain indices from the following price relatives of four commodities using geometric mean as an average. Price Relatives of Commodities Year A B C D 1951 14.6 21.6 250.0 119.0 1952 12.7 13.8 159.0 128.0 1953 12.1 15.0 130.0 111.0 1954 121.6 241.6 216.0 165.0It is known that The New York Times’ circulation is 731,500 print copies. You publish three advertisements in the NYT a week and run your campaign for 12 weeks. What are the total audience impressions (TAI) you can get over the period of 12 weeks?multiple choice. answer only Question 1. This market structure has a lot of competitors selling non-identical goods.A. Perfect competition C. OligopolyB. Monopolistic competition D. Monopoly2. What does a discount rate in the net present value signify?A. Amount of interest earned C. Firm's time and risk preferenceB. Amount needed by the firm D. Rate of firm's growth3. Why does the value of money diminish over time?A. Inflation C. Decrease in consumer informationB. Increase in competition D. Interest rates4. Which disequilibrium profit theory is applicable to businesses with high capitalrequirements?A. Frictional profit theory C. Compensatory profit theoryB. Innovation profit theory D. Monopoly profit theory5. Which of these is NOT part of the three (3) basic economic questions?A. What commodities should be produced?B. How should those commodities be produced?C. Why should the commodities be produced?D. For whom are those commodities produced?6. Which of these…
- The Kalamazoo Brewing Company (KBC) currently sells its microbrews in a seven-state area: Illinois, Indiana,Michigan, Minnesota, Mississippi, Ohio, and Wisconsin. The company’s data analytics department has collecteddata from its distributors in each state. This data consists of the quantity of cases and price (per case) ofmicrobrews sold in each state, as well as the average income (in thousands of dollars) of consumers living invarious regions of each state. The data for each state are available in the Excel file on Brightspace--please notethere are multiple tabs at the bottom of the spreadsheet, each refers to one of the seven states selling theKalamazoo Brewing Company’s microbrews. You will use the data to estimate the linear demand function fortheir microbrews in Indiana. To do this, perform the regression analysis in Excel for the data provided forIndiana.a. Write out the estimated linear demand function for microbrews in Indiana as a function of the price percase (P) and…5. Create a histogram of profit at the productionlevel Q. Create a histogram of profit when theproduction level Q equals mean demand. Whatis the probability of a loss greater than $100,000in each case? ■1. What is an example of a company that uses a signal to help sell its product. What is the signal? 2. What information is the signal trying to convey? 3. Is the signal effective? Why or why not?