a. For this study, we should use t-test for a popułation mean b. The null and alternative hypotheses would be: Hạ: [pvv = C. The test statistic t v (please show your answer to3 decimal places.)
a. For this study, we should use t-test for a popułation mean b. The null and alternative hypotheses would be: Hạ: [pvv = C. The test statistic t v (please show your answer to3 decimal places.)

Glencoe Algebra 1, Student Edition, 9780079039897, 0079039898, 2018
18th Edition
ISBN:9780079039897
Author:Carter
Publisher:Carter
Chapter10: Statistics
Section10.4: Distributions Of Data
Problem 22PFA

Related questions
Topic Video
Question
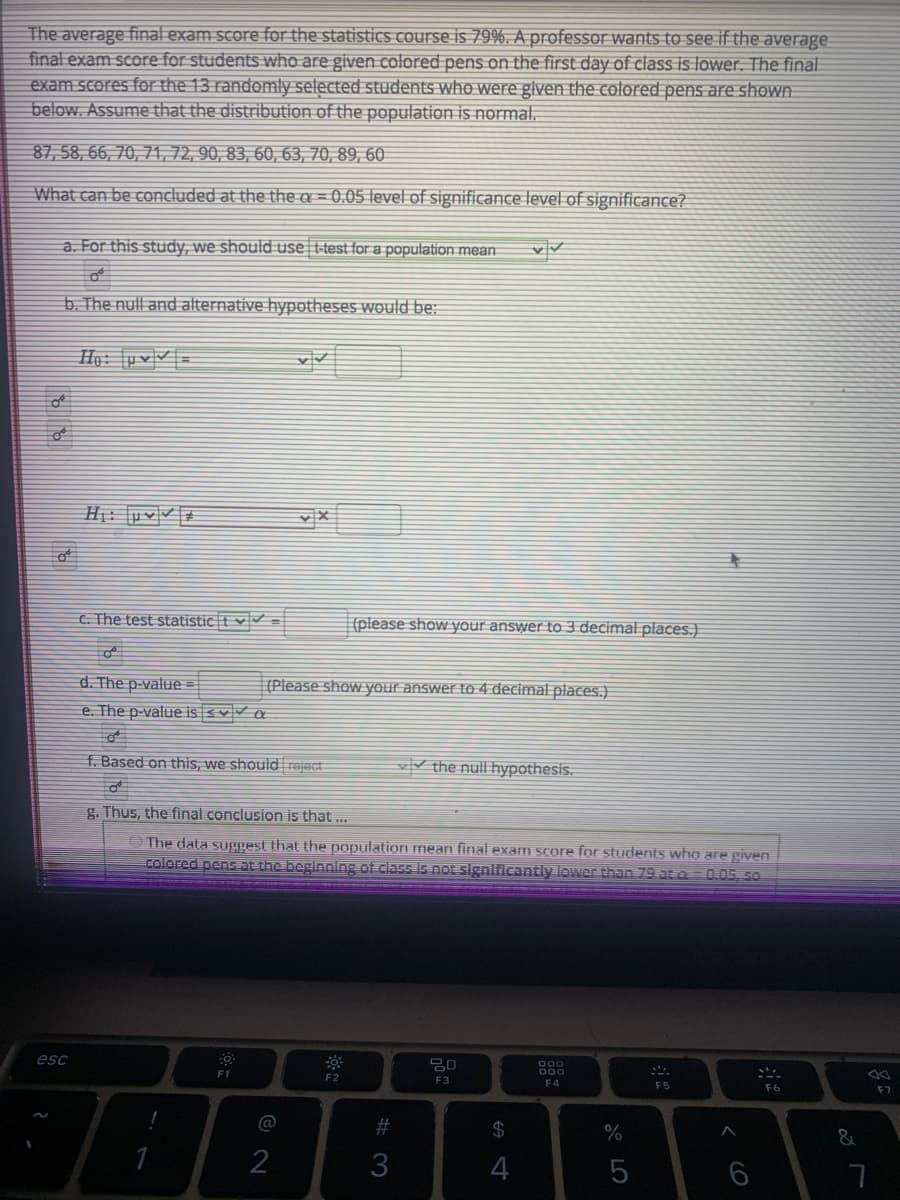
Transcribed Image Text:The average final exam score for the statistics course is 79%. A professor wants to see if the average
final exam score for students who are given colored pens on the first day of class is lower. The final
exam scores for the 13 randomly selected students who were glven the colored pens are shown
below. Assume that the distribution of the population is normal.
87, 58, 66, 70, 71, 72, 90, 83, 60, 63, 70, 89, 60
What can be concluded at the the a = 0.05 level of significance level of significance?
a. For this study, we should use t-test for a population mean
b. The null and alternative hypotheses would be:
Hạ: [pv|V| =
H: [uvv #
C. The test statistic t v
(please show your answer to 3 decimal places.)
d. The p-value =
(Please show your answer to 4 decimal places.)
e. The p-value is <v a
f. Based on this, we should rajact
vV the null hypothesis.
g. Thus, the final conclusion is that ...
O The data suggest that the population mean final exam score for students who are given
colored pens at the beginnlng of class Is not signlficantly lower than 79 at a= 0.05, 50
esc
F2
F3
F4
F5
F6
F7
@
%23
24
%
2
3
4
Expert Solution
This question has been solved!
Explore an expertly crafted, step-by-step solution for a thorough understanding of key concepts.

Step by step
Solved in 2 steps

Knowledge Booster


Learn more about
Need a deep-dive on the concept behind this application? Look no further. Learn more about this topic, statistics and related others by exploring similar questions and additional content below.Recommended textbooks for you
Glencoe Algebra 1, Student Edition, 9780079039897…
Algebra
ISBN:
9780079039897
Author:
Carter
Publisher:
McGraw Hill

Holt Mcdougal Larson Pre-algebra: Student Edition…
Algebra
ISBN:
9780547587776
Author:
HOLT MCDOUGAL
Publisher:
HOLT MCDOUGAL

Big Ideas Math A Bridge To Success Algebra 1: Stu…
Algebra
ISBN:
9781680331141
Author:
HOUGHTON MIFFLIN HARCOURT
Publisher:
Houghton Mifflin Harcourt
Glencoe Algebra 1, Student Edition, 9780079039897…
Algebra
ISBN:
9780079039897
Author:
Carter
Publisher:
McGraw Hill
Holt Mcdougal Larson Pre-algebra: Student Edition…
Algebra
ISBN:
9780547587776
Author:
HOLT MCDOUGAL
Publisher:
HOLT MCDOUGAL
Big Ideas Math A Bridge To Success Algebra 1: Stu…
Algebra
ISBN:
9781680331141
Author:
HOUGHTON MIFFLIN HARCOURT
Publisher:
Houghton Mifflin Harcourt