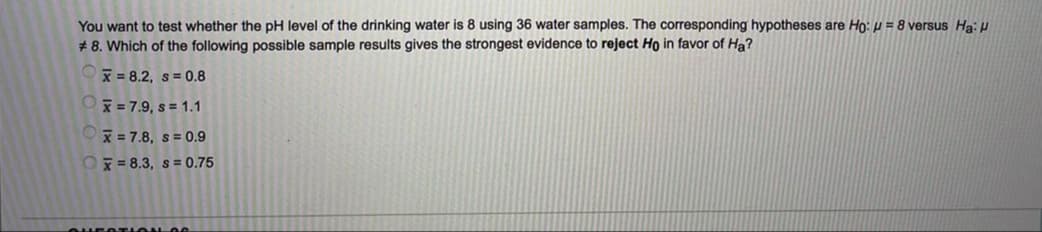
You want to test whether the pH level of the drinking water is 8 using 36 water samples. The corresponding hypotheses are Ho: µ = 8 versus Ha: H # 8. Which of the following possible sample results gives the strongest evidence to reject Ho in favor of Ha? x = 8.2, s = 0.8 x = 7.9, s = 1.1 x = 7.8, s = 0.9 Ox = 8.3, s= 0.75


Q: (d) Suppose it had previously been believed that when air void increased by 1 percent, the…
A:
Q: at 5% significance level Họ HZ HO; Ho iH < HO If the test statistic calculated to test the…
A: NOTE: As per the guidelines, we are supposed to solve one question only. Kindly repost other as…
Q: A researcher conducts a hypothesis test using a sample of n=20 with M =34 and s^2=36 from an unknown…
A: Here, the known values are n=20 with M =34 and s2=36.
Q: For the following data, state the null and alternative hypotheses. What is the chi-square and the…
A: Formulation of HypothesisNull Hypothesis H0: - The distribution is uniformAlternative Hypothesis H1:…
Q: A paired difference experiment yielded the results shown below. na = 45 Xd = 16.4 a. Test Ho: Hd =…
A:
Q: A Pandom sample of 70 observations produced a sample proportion equal to 0.37. Find the critical and…
A: Let p^ be the sample proportion. p^ = 0.37 n: The sample size = 470 Let p be the hypothesized…
Q: A study assessed the lung destructive index among smokers and non- smokers provided the following…
A: H0 : The smokers and non smokers have the same lung damage i.e. μ1=μ2 H1 : The smokers have greater…
Q: A hospital administrator claims that the proportion of knee surgeries that are successful is 87%. To…
A: The provided information are:Sample size (n) = 450Hypothesised proportion (po)=0.87From the provided…
Q: Penicillin is produced by the Penicillin fungus, which is grown in a broth whose sugar content must…
A: The ANOVA is conducted by using EXCEL. The software procedure is given below: Enter the data.…
Q: You wish to test the following claim (HaHa) at a significance level of α=0.001α=0.001.…
A: We have given that Sample sizes n1=10 , n2=12 Sample means X̄1=54.6 , X̄2=41.8…
Q: (e) You wish to test the null hypothesis Họ: µz 244 mg/100 ml against the alternative HA: µ<244…
A:
Q: Question 16: Test the claim that the proportion of people who own cats is larger than 50% at the…
A:
Q: You are testing the null hypothesis that there is no relationship between two variables, X and Y.…
A: FORMULA : F = MSR/MSE
Q: If you have a hypothesis test with alpha = 0.09, which of the following P-Values does NOT imply…
A:
Q: With H1: p + 0.3827, the test statistic is z = %3D 2.324. For 0.1 significance level what are the…
A: Given : H1 : P ≠0.3827 Z = 2.324 Level of significance = 0.1
Q: 2. Find the test statistic (2 decimal places) 3. Give the P-value (4 decimal places) please…
A: 2. The sample proportion for non-seatbelt wearing passengers is, p^N=xNnN=34335=0.1015 The sample…
Q: In a test of H0: µ=150 against HA: µ<150, a sample of size 250 produces Z = -0.65 for the value…
A: The z statistic value is –0.65. Step-by-step procedure to obtain the p-value using standard normal…
Q: The recommended daily dietary allowance for zinc among males older than age 50 years is 15 mg/day.…
A: Givensample size(n)=119Mean(x)=12.9standard deviation(s)=6.61α=0.05
Q: Last year the mean cost u for a one-bedroom rental in a certain city was $1,200 per month. Eli is…
A: We have to find correct hypothesis.
Q: Suppose a researcher is testing the hypothesis Hn: p= 0.6 versus H,: p<0.6 and she finds the P-value…
A: Given : P-value = 0.28
Q: A random sample of n=4 individuals is selected from population with µ = 35, and a treatment is…
A: a. The difference between the mean for the treated sample and the mean for the original population…
Q: Suppose a researcher is testing the hypothesis Hn: p=0.6 versus H,: p<0.6 and she finds the P-value…
A: The random variable X follows normal distribution. We have to test whether the population proportion…
Q: Only about 12% of all people can wiggle their ears. Is this percent lower for millionaires? Of the…
A:
Q: If you were assigned to develop an experiment to determine if adding specific insecticides will kill…
A: Qualitative research is the process of gathering and evaluating non-numerical data in order to…
Q: For an acceptable quality level (AQL) of 1%, a lot tolerance proportion defective (LTPD) of 4% and a…
A: Given:-
Q: You conduct a statistical test of hypotheses and find that your data are statistically significant…
A: No , If we test the hypothesis at the α=0.05 level of significant and it may be significant, but we…
Q: Consider the following hypothesis test: H0: mu >= 20 Halpha:mu < 20 A sample of 50 provided a…
A: From the provided information, The test is left tailed. Sample size (n) = 50 Sample mean (x̄) = 19.4…
Q: concentration differs among the three days? Use the =α0.05 level of significance and the ANOVA…
A:
Q: Find the P-value that corresponds to the given standard score, and determine whether to reject the…
A:
Q: The desired percentage of Sio, in a certain type of aluminous cement is 5.5. To test whether the…
A:
Q: When computing the Z value to compare between two samples of two populations, o2 is a parameter of…
A: The Formula for z value is : z=Xˉ1−Xˉ2- (μ1-μ2)σ12n1+σ22n2
Q: Conduct a hypothesis test using an alpha level of α = .01 to determine if the correlation is…
A: Given that the correlation between Job satisfaction and work-life balance is given by r = 0.69…
Q: Question 12: Test the claim that the proportion of men who own cats is larger than 50% at the .005…
A:
Q: In a test of H0:p=0.4 against Ha:p≠0.4, a sample of size 100 produces z=1.28 for the value of the…
A:
Q: The following information is available for two samples drawn from independent normally distributed…
A: The degrees of freedom for population A is n-1 = 10-1 =9.
Q: Suppose you got a P-value of 0.023. Would this be statistically significant at the 0.05 level?…
A: Given, P-value = 0.023 The objective is to find is this p-value statistically significant at…
Q: What statistical test would you use for each of the following scenarios? What would you set your…
A: Given that, Dahlia is interested in how depression impacts willingness to exercise and go to the…
Q: 3. Consider the following competing hypotheses: (You may find it useful to reference the appropriate…
A:
Q: Following from the last question, imagine, over the course of your study more participants in the…
A: Here correct answer is, There is now more individual differences within the violent video game…
Q: Penicillin is produced by the Penicillium fungus, which is grown in a broth whose sugar content must…
A:
Q: onstruct an ANOVA table. Round your answers to four decimal places as needed. One-way ANOVA: Sugar…
A: The ANOVA is conducted by using EXCEL. The software procedure is given below: Enter the data.…
Q: The recommended daily dietary allowance for zinc among males older than age 50 years is 15 mg/day.…
A:
Q: If you have a hypothesis test with alpha = 0.1, which of the following P-Values does NOT imply…
A:
Q: You obtain a t comp of .975 in a two sample independent t test with alpha at .05. Is it…
A: Two sample t test is used to test the significance difference between two group mean. P value : The…
Q: Independent random samples of 17 sophomores and 13 juniors attending a large university yield the…
A: Given Data : For Sample 1 x̄1 = 2.75 s1 = 0.31 n1 = 13 For Sample 2…
Q: Penicillin is produced by the Penicillium fungus, which is grown in a broth whose sugar content must…
A: Since you have posted a question with multiple sub-parts, we will solve first three subparts for…
Q: andres asked if there is a relationship between the quality of sneakers worn by a sample of 20…
A: Given that the sample size is n=20. The correlation coefficient based on sample size is r=0.21.…
Q: If you collect data from a random sample of 10 students and we would like test for statistical…
A:
Q: the hypothesis that o_A^2=o_B^2 against o_A^2#o_B^2 at a level of significance a=0.05. Does this…
A: Here comparing two instruments accuracy For that comparing variance of measurements by both…
Q: Question 9 What is the value for the t test statistic? O 0.673 O 2.673 O 3.673 O 1.673 Question 10…
A: The given results are, Control:M=64.1,SS=5468,n=10, and Meditative Breather:M=71.6,SS=5724,n=10.
Kindly do it asap and correctly only cross check once after doing it's important to me

Step by step
Solved in 2 steps with 2 images

- If the test of H0: = 19 against Ha: ≠ 19 based on an SRS of 15 observations from a Normal populationproduces the statistic of t = –1.75. The P-value isAre seatbelts effective at saving lives? We wish to examine whether or not the use of seatbelts reduces fatalities at the alpha = 0.05 level of significance. Let p N represent the proportion of non-seatbelt wearing passengers who were involved in a crash and died and represent the proportion of seatbelt wearing passengers who were involved in a crash and died. 1. Which would be correct hypotheses for this test? H 0 :p N =p Y ,H 1 :p N <p Y O H 0 :p N =p Y ,H 1 :p N ne p Y H 0 :p N =p Y ,H 1 :p N > mathfrak P Y O H 0 :p N ne p Y , H 1 :p N >p Y In a random sample of 335 non-seatbelt wearing passengers involved in a car crash, 34 were killed. In a random sample of 398 seatbelt wearing passengers involved in a car crash , 18 were killed. 2. Find the test statistic (2 decimal places) 3. Give the P-value (4 decimal places) please only answer 2 and 3!In a test of H0: p = .43 versus Ha: p ≠ .43, a sample of size 1500 leads to a p-value of 0.087. Which of the following must be true if a = 0.05? A. The Ho should be rejected at the 5% level B. The Ho should fail to be rejected at the 5% level C. The Ho should be accepted at the 5% level
- The desired percentage of SiO2 in a certain type of aluminous cement is 5.5. To test whether the true average percentage is 5.5 for a particular production facility, 16 independently obtained samples are analyzed. Suppose that the percentage of SiO2 in a sample is normally distributed with ? = 0.32 and that x = 5.21. (Use ? = 0.05.) (a) Does this indicate conclusively that the true average percentage differs from 5.5?State the appropriate null and alternative hypotheses. H0: ? = 5.5Ha: ? ≠ 5.5H0: ? = 5.5Ha: ? ≥ 5.5 H0: ? = 5.5Ha: ? < 5.5H0: ? = 5.5Ha: ? > 5.5 Calculate the test statistic and determine the P-value. (Round your test statistic to two decimal places and your P-value to four decimal places.) z = P-value = State the conclusion in the problem context. Do not reject the null hypothesis. There is sufficient evidence to conclude that the true average percentage differs from the desired percentage.Reject the null hypothesis. There is sufficient evidence…Consider the following: In general, when people diet they typically lose 10 lbs. (?σ = 2). A random sample of 16 people on the keto diet lost 15 lbs. Do people on the keto diet lose more or less weight than people on diets in general? 4. What is the research hypothesis? a) Weight loss in the keto diet sample does not differ from weight loss in the population of dieters in general (H1: X-bar = Mu) b)Weight loss in the keto diet sample does differ from weight loss in the population of dieters in general (H1: X-bar = Mu) c) Weight loss in the keto diet sample does not differ from weight loss in the population of dieters in general (H1: X-bar does not equal Mu) d) Weight loss in the keto diet sample does differ from weight loss in the population of dieters in general (H1: X-bar does not equal Mu)In a test of H0 : μ = 5 versus H1 : μ ≠ 5, the sample mean was X¯¯¯ = 4 and the P-value was 0.21. This means that if μ = 5, and the experiment were repeated 100 times, we would expect to obtain a value of X¯¯¯ between 4 and 6 approximately _____ times.
- In a comparison of two methods for the determination of chromium in rye grass, the following results were obtained: Method A, mean(mg/kg Cr)=1.48 Standard deviation(mg/kg Cr)=0.28 n= 6 Method B, mean (mg/kg Cr)=2.33 Standard deviation(mg/kg Cr)=0.31 n=10 Is the precision of these two methods significantly different? Do these two methods give results with means which differ significantly? a=0.05You are testing against based on an SRS of 20 observations from a Normal population. The t statistic is t= -2.25. Using Table B, the P-value falls between and .Serum nitrite concentrations (in μmol/L) were compared between a group of unmedicated HIV+ subjects (n =7) and a control group (n = 10). The HIV+ distribution is strongly skewed.a) Use a Wilcoxon-Mann-Whitney U test to determine if there is convincing evidence at α = 0.05 thatserum nitrite levels differ between the two populations. b) What would have been the U test p-value if researchers had instead hypothesized that serum nitriteconcentrations would tend to be larger in the HIV+ population? HIV+ Control 0.266 0.167 0.269 0.201 0.299 0.205 0.335 0.232 0.503 0.234 0.846 0.260 0.946 0.268 0.288 0.301 0.305
- Serum nitrite concentrations (in μmol/L) were compared between a group of unmedicated HIV+ subjects (n =7) and a control group (n = 10). The HIV+ distribution is strongly skewed. a) Use a Wilcoxon-Mann-Whitney U test to determine if there is convincing evidence at α = 0.05 thatserum nitrite levels differ between the two populations. b) What would have been the U test p-value if researchers had instead hypothesized that serum nitriteconcentrations would tend to be larger in the HIV+ population?Let ?1 denote true average tread life for a premium brand of P205/65R15 radial tire, and let ?2 denote the true average tread life for an economy brand of the same size. Test H0: ?1 − ?2 = 5000 versus Ha: ?1 − ?2 > 5000 at level 0.01, using the following data: m = 45, x = 42,100, s1 = 2400, n = 45, y = 36,200, and s2 = 1800.Calculate the test statistic and determine the P-value. (Round your test statistic to two decimal places and your P-value to four decimal places.) z = P-value = State the conclusion in the problem context. Fail to reject H0. The data does not suggest that the difference in average tread life exceeds 5000.Reject H0. The data suggests that the difference in average tread life exceeds 5000. Fail to reject H0. The data suggests that the difference in average tread life exceeds 5000.Reject H0. The data does not suggest that the difference in average tread life exceeds 5000.Let ?1 denote true average tread life for a premium brand of P205/65R15 radial tire, and let ?2 denote the true average tread life for an economy brand of the same size. Test H0: ?1 − ?2 = 5000 versus Ha: ?1 − ?2 > 5000 at level 0.01, using the following data: m = 45, x = 42,100, s1 = 2400, n = 45, y = 36,200, and s2 = 1800. Calculate the test statistic and determine the P-value. (Round your test statistic to two decimal places and your P-value to four decimal places.) z = P-value = State the conclusion in the problem context. Fail to reject H0. The data does not suggest that the difference in average tread life exceeds 5000.Reject H0. The data suggests that the difference in average tread life exceeds 5000. Fail to reject H0. The data suggests that the difference in average tread life exceeds 5000.Reject H0. The data does not suggest that the difference in average tread life exceeds 5000.