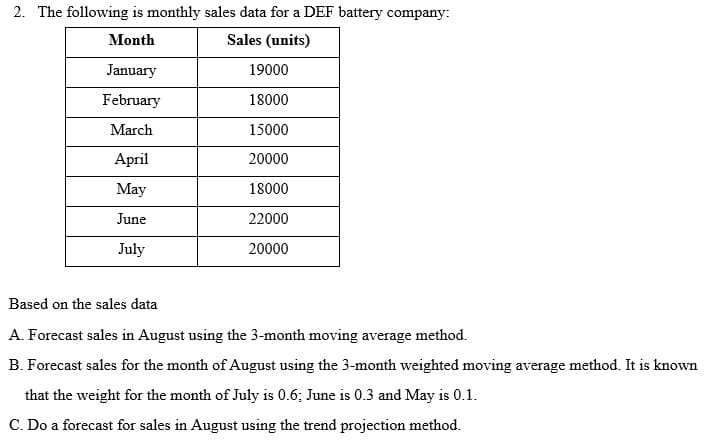
A. Forecast sales in August using the 3-month moving average method. B. Forecast sales for the month of August using the 3-month weighted moving average method. It is known that the weight for the month of July is 0.6; June is 0.3 and May is 0.1. C. Do a forecast for sales in August using the trend projection method.


Q: Do: 12-21 Truck drivers working for Juhn and Sons (see Problems 12-19 and 12-20) are paid a salary…
A: Given information: Truck drivers salary=$20 per hour on average Fruit loaders receive $12 per hour…
Q: Is operations management relevant to nonbusiness organizations such as colleges and hospitals? Why…
A: Operations management is used in different organizations differently.
Q: Explain the expression "Adoption of ‘Quick Response’ (QR) aims to cut inventory levels and improve…
A: Quick response is often used by most of the organizations to improve the efficiency through out the…
Q: Question one What challenges have been faced by various bodies when implementing e- procurement in…
A: E-procurement is the business-to-business, business-to-consumer purchase and sales of supplies and…
Q: define descriptive research
A: A descriptive research is a tool which is used to collect data related to specified group or area.
Q: Scheduling in service organizations is different from manufacturing in all of the following ways…
A: Scheduling in service organization and manufacturing organization are specifying different…
Q: Suppose it is decided that the number of hours used in the assembly process must be at least 80% of…
A:
Q: The GEM maker of jewelry makes two bracelet designs, heart design and flower design. The bracelets…
A: given, store 28 ounces of gold 20 ounces of platinum profit P2500
Q: A company estimates that it will take 20 hours and 42 direct labor hours to construct the 50th and…
A: Production is the process of converting raw materials into final goods that will be used for…
Q: Why are environmental concerns and sustainability often addressed in the operations function?
A: Environmental sustainability entails engaging appropriately with the world in order to preserve…
Q: A high-speed train operator schedules six trains per day departing from City A. The destination of…
A:
Q: What needs to be done so results in delivery of project work reflect specified product scope? O a.…
A: Prodcut scope is defined as features that characterize a product or a service.
Q: Explain how purchasing, inventory control, scheduling, and quality control affect production.
A: Production:- The term production has many definitions depending on which field you’re in. For…
Q: Determine the optimum preventive maintenance frequency for each of the pieces of equipment if…
A: Probability ratio = Preventive cost / breakdown cost Interval = Average time + (z x standard…
Q: d. Determine the probability that the team and the contractor will be in place and the project…
A: Based on the 3-time estimates given, we find the Expected duration and Variance for each activity as…
Q: 4. XYZ Brownies is a culinary business that specializes in making brownie cakes with various flavors…
A: Find the given details below: Given details Output 18000 Brownies Effective Capacity (Current…
Q: To attract, satisfy, and retain the better customers during the upcoming year, a business would…
A: Customer satisfaction can be stated as the measurement that evaluates how happy the clients are with…
Q: Eight Flags operates several amusement parks in the Midwest. The company stocks machine oil to…
A: Administrative expenses are charges incurred to keep a business running smoothly but are not…
Q: Solve the following problem using the three methods, and after solving the problem, use a method for…
A: Three methods are: NWCM LCM VAM optimal solution is found using MODI and stepping stone method.
Q: Write a sample and sampling technique for the research topic: Relationships between Job Stress and…
A: Research topic: Relationships between Job Stress and Employee Well-Being in the Implications of…
Q: Describe project scheduling strategies such as WBS, AD, and AS (AS). Describe and define.
A: WORK BREAKDOWN STRUCTURE: Work breakdown structure is a toll for breaking up the project into its…
Q: why do you think scheduling issues often cause great concern for project managers?
A: Project scheduling begins with identifying and estimating the durations for different tasks in the…
Q: The standard form of the following linear programming model is given. Find the values of variables…
A:
Q: Evaluate the range of restructuring options for an existing ‘bricks-and-mortar’ organization to move…
A: Restructuring can be stated as the action taken by an organization to significantly upgrade the…
Q: It takes 1 minute to remove a burger from the cooler. The burger is cooked for 2 minutes and…
A: A bottleneck refers to a point of congestion in a process because the workload arrives too quickly…
Q: Explain Five Phases of Project Management with examples.
A: Project management is the management in which different kinds of skills, knowledge, and techniques…
Q: How do the operations strategic decisions differ for a product imitator strategy versus a product…
A: There are various criterias on the basis of which the product imitator strategy differs from a…
Q: Consider the following integer linear programming problem. Маx Z - 4x +3у Subject to: 4x + 6y < 35…
A:
Q: Discuss the fundamental value of a strong Human Resource department and how it affects different…
A: Note - Hi! Thank you for the question As per the honour code, We’ll answer the first question since…
Q: For the independent nation Eireland in 2019, if GDP = €356.1bn, C = €111.6bn, G = €34.8bn, X =…
A: Given: In 2019 GDP value GDP=∈356.1bn C=∈111.6bn (consumption expenditure) G=∈34.8bn (Government…
Q: How to collect subjective data for a traveling business.
A: Travel data gathering is critical for the effective design and management of transportation…
Q: What advantages does object-oriented analysis provide in system analysis and design?
A: Object oriented analysis is the process of finding where a team building team appreciates and…
Q: Mr. A, an employee, timed in 4 minutes and 27 seconds late for work this morning. While he won't get…
A: The given circumstances can be explained via the principal of GVV. Understated are the seven…
Q: Walton Company has measured its quality costs for the past two years. After the company gathers its…
A: The total cost of quality consists of prevention cost, cost of the appraisal, cost of internal…
Q: Given the building layout for Store A, Store B, Store C, and Store D, what portion of the shared…
A: Apportioned cost is the method of distributing the different cost on the basis of proportion. It is…
Q: If cycle inventory is 1,000 and the average flow time is 4 weeks, then the number of replenishments…
A:
Q: Compute a weighted three-month moving average forecast using weights of (a) 10%, 30%, 60%, and (b)…
A: 10%= 0.1 30%=0.3 60%=0.6 25%=0.25 45%=0.45
Q: What are Value-Added Services? Give examples with regards to Offering and Extranet Service.
A: A service provider can be stated as the vendor that offers technical solution services to the…
Q: PLEASE PROVIDE STEPS WHEN FINDING SOLUTIONS In a SIX server model, find the percentage of the time a…
A: percentage of time a server would be busy is called server utilization. Server utilization is…
Q: Explain your understanding about Performance Dashboard, what they should do, and why they're…
A: Key performance indicators are described as the important indicators that highlight the progress…
Q: What, according to the organizers of the Putting Lot, is the theme that carries throughout their…
A: Note- Hi! Thank you for the question As per the honour code, We’ll answer the first question since…
Q: In the game shown below, Player 1 can move Up or Down, and Player 2 can move Left or Right. The…
A: Given data: Player 2 Player 1 Left Right Up 3, 2 2, 3 Down 0,9 1, 1
Q: According to Table 8-2, which describes a media selection problem, what would the objective function…
A: The objective function is equation written mathematically that shows the production output with…
Q: Explain the impact of effective complaints management towards successful product or service design.
A: Clients will continually grumble about an item or administration that your organization gives. You…
Q: a) What challenges have been faced by various bodies when implementing e-procurement in…
A: A. Procurement directors wear several hats and are in charge of a wide variety of responsibilities,…
Q: With the implementation of legislation, the Electronic Signatures in Global and National Commerce…
A: Digital signature is a type of ciphered code which is quite significant and it is used to attest any…
Q: What are Booth's algorithm's objectives?
A: Booth's algorithm generally known as Booth's multiplication algorithm that provide a way to multiply…
Q: Q2 / Find the basic solution of the transportation model using my method (Less Cost, Vogel Approx
A:
Q: There are seventeen qualities of a good researcher. Which of them is the most important quality and…
A: A researcher is an individual or a firm who makes a research related to a particular aspect of a…
Q: The average weekly demand of an item is 200 units, and the standard deviation of weekly demand is…
A: Formulas used:
Solve max in 90 minutes the sub parts A,B,C and no reject thank u about Operational Managament

Step by step
Solved in 2 steps with 11 images

- The file P13_42.xlsx contains monthly data on consumer revolving credit (in millions of dollars) through credit unions. a. Use these data to forecast consumer revolving credit through credit unions for the next 12 months. Do it in two ways. First, fit an exponential trend to the series. Second, use Holts method with optimized smoothing constants. b. Which of these two methods appears to provide the best forecasts? Answer by comparing their MAPE values.The Baker Company wants to develop a budget to predict how overhead costs vary with activity levels. Management is trying to decide whether direct labor hours (DLH) or units produced is the better measure of activity for the firm. Monthly data for the preceding 24 months appear in the file P13_40.xlsx. Use regression analysis to determine which measure, DLH or Units (or both), should be used for the budget. How would the regression equation be used to obtain the budget for the firms overhead costs?The file P13_28.xlsx contains monthly retail sales of U.S. liquor stores. a. Is seasonality present in these data? If so, characterize the seasonality pattern. b. Use Winters method to forecast this series with smoothing constants = = 0.1 and = 0.3. Does the forecast series seem to track the seasonal pattern well? What are your forecasts for the next 12 months?
- The file P13_26.xlsx contains the monthly number of airline tickets sold by the CareFree Travel Agency. a. Create a time series chart of the data. Based on what you see, which of the exponential smoothing models do you think will provide the best forecasting model? Why? b. Use simple exponential smoothing to forecast these data, using a smoothing constant of 0.1. c. Repeat part b, but search for the smoothing constant that makes RMSE as small as possible. Does it make much of an improvement over the model in part b?The file P13_29.xlsx contains monthly time series data for total U.S. retail sales of building materials (which includes retail sales of building materials, hardware and garden supply stores, and mobile home dealers). a. Is seasonality present in these data? If so, characterize the seasonality pattern. b. Use Winters method to forecast this series with smoothing constants = = 0.1 and = 0.3. Does the forecast series seem to track the seasonal pattern well? What are your forecasts for the next 12 months?The file P13_22.xlsx contains total monthly U.S. retail sales data. While holding out the final six months of observations for validation purposes, use the method of moving averages with a carefully chosen span to forecast U.S. retail sales in the next year. Comment on the performance of your model. What makes this time series more challenging to forecast?
- The file P13_02.xlsx contains five years of monthly data on sales (number of units sold) for a particular company. The company suspects that except for random noise, its sales are growing by a constant percentage each month and will continue to do so for at least the near future. a. Explain briefly whether the plot of the series visually supports the companys suspicion. b. By what percentage are sales increasing each month? c. What is the MAPE for the forecast model in part b? In words, what does it measure? Considering its magnitude, does the model seem to be doing a good job? d. In words, how does the model make forecasts for future months? Specifically, given the forecast value for the last month in the data set, what simple arithmetic could you use to obtain forecasts for the next few months?The owner of a restaurant in Bloomington, Indiana, has recorded sales data for the past 19 years. He has also recorded data on potentially relevant variables. The data are listed in the file P13_17.xlsx. a. Estimate a simple regression equation involving annual sales (the dependent variable) and the size of the population residing within 10 miles of the restaurant (the explanatory variable). Interpret R-square for this regression. b. Add another explanatory variableannual advertising expendituresto the regression equation in part a. Estimate and interpret this expanded equation. How does the R-square value for this multiple regression equation compare to that of the simple regression equation estimated in part a? Explain any difference between the two R-square values. How can you use the adjusted R-squares for a comparison of the two equations? c. Add one more explanatory variable to the multiple regression equation estimated in part b. In particular, estimate and interpret the coefficients of a multiple regression equation that includes the previous years advertising expenditure. How does the inclusion of this third explanatory variable affect the R-square, compared to the corresponding values for the equation of part b? Explain any changes in this value. What does the adjusted R-square for the new equation tell you?A small computer chip manufacturer wants to forecast monthly ozperating costs as a function of the number of units produced during a month. The company has collected the 16 months of data in the file P13_34.xlsx. a. Determine an equation that can be used to predict monthly production costs from units produced. Are there any outliers? b. How could the regression line obtained in part a be used to determine whether the company was efficient or inefficient during any particular month?
- The file P13_25.xlsx contains the quarterly numbers of applications for home mortgage loans at a branch office of Northern Central Bank. a. Create a time series chart of the data. Based on what you see, which of the exponential smoothing models do you think will provide the best forecasting model? Why? b. Use simple exponential smoothing to forecast these data, using a smoothing constant of 0.1. c. Repeat part b, but search for the smoothing constant that makes RMSE as small as possible. Does it make much of an improvement over the model in part b? Is it guaranteed to produce better forecasts for the future?Suppose that a regional express delivery service company wants to estimate the cost of shipping a package (Y) as a function of cargo type, where cargo type includes the following possibilities: fragile, semifragile, and durable. Costs for 15 randomly chosen packages of approximately the same weight and same distance shipped, but of different cargo types, are provided in the file P13_16.xlsx. a. Estimate a regression equation using the given sample data, and interpret the estimated regression coefficients. b. According to the estimated regression equation, which cargo type is the most costly to ship? Which cargo type is the least costly to ship? c. How well does the estimated equation fit the given sample data? How might the fit be improved? d. Given the estimated regression equation, predict the cost of shipping a package with semifragile cargo.The file P13_27.xlsx contains yearly data on the proportion of Americans under the age of 18 living below the poverty level. a. Create a time series chart of the data. Based on what you see, which of the exponential smoothing models do you think will provide the best forecasting model? Why? b. Use simple exponential smoothing to forecast these data, using a smoothing constant of 0.1. c. Repeat part b, but search for the smoothing constant that makes RMSE as small as possible. Create a chart of the series with the forecasts superimposed from this optimal smoothing constant. Does it make much of an improvement over the model in part b? d. Write a short report to summarize your results. Considering the chart in part c, would you say the forecasts are good?

