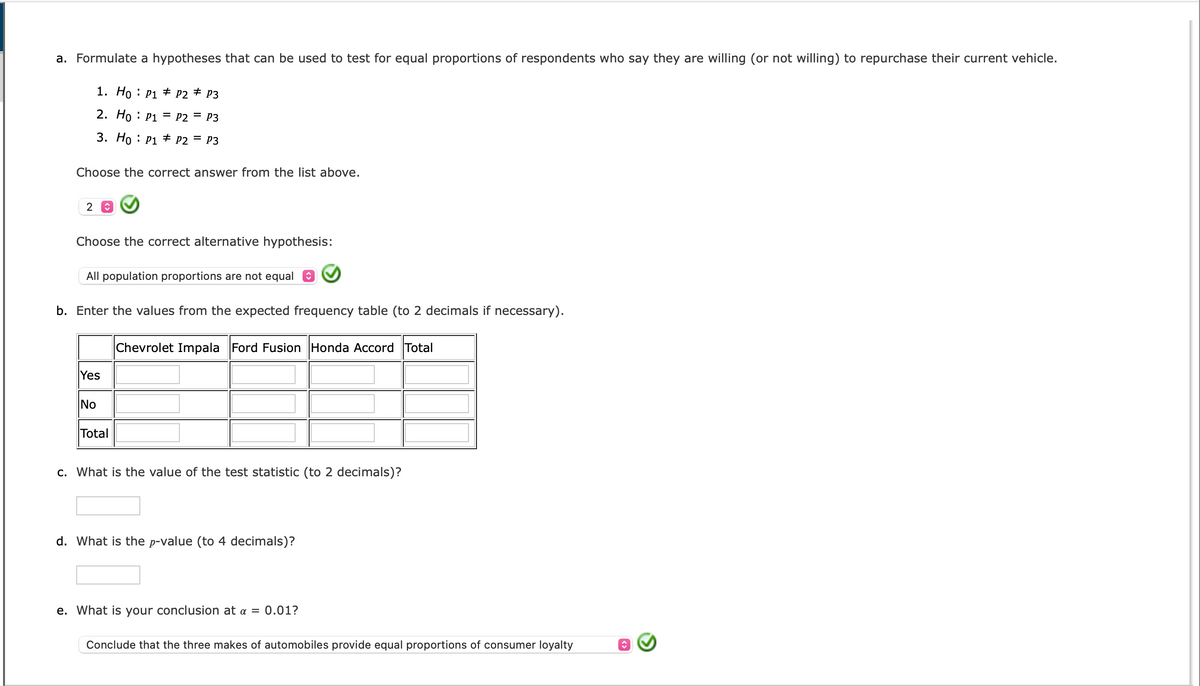
a. Formulate a hypotheses that can be used to test for equal proportions of respondents who say they are willing (or not willing) to repurchase their current vehicle. 1. Ho P1 P2 P3 2. Ho P1 P2 = P3 3. Ho P1 P2 = P3 Choose the correct answer from the list above. 2 Choose the correct alternative hypothesis: All population proportions are not equal b. Enter the values from the expected frequency table (to 2 decimals if necessary). Yes No Total Chevrolet Impala Ford Fusion Honda Accord Total c. What is the value of the test statistic (to 2 decimals)? d. What is the p-value (to 4 decimals)? e. What is your conclusion at α = 0.01? Conclude that the three makes of automobiles provide equal proportions of consumer loyalty
a. Formulate a hypotheses that can be used to test for equal proportions of respondents who say they are willing (or not willing) to repurchase their current vehicle. 1. Ho P1 P2 P3 2. Ho P1 P2 = P3 3. Ho P1 P2 = P3 Choose the correct answer from the list above. 2 Choose the correct alternative hypothesis: All population proportions are not equal b. Enter the values from the expected frequency table (to 2 decimals if necessary). Yes No Total Chevrolet Impala Ford Fusion Honda Accord Total c. What is the value of the test statistic (to 2 decimals)? d. What is the p-value (to 4 decimals)? e. What is your conclusion at α = 0.01? Conclude that the three makes of automobiles provide equal proportions of consumer loyalty

MATLAB: An Introduction with Applications
6th Edition
ISBN:9781119256830
Author:Amos Gilat
Publisher:Amos Gilat
Chapter1: Starting With Matlab
Section: Chapter Questions
Problem 1P

Related questions
Question
100%
Organizations such as J.D. Power and Associates use the proportion of owners likely to repurchase a particular automobile as an indication of customer loyalty for the automobile. An automobile with a greater proportion of owners likely to repurchase is concluded to have greater customer loyalty.
A study was conducted to compare the customer loyalty for three automobiles: Chevrolet Impala, Ford Fusion, and Honda Accord. The study contained 500 respondents and the data is summarized in the Microsoft Excel Online file below. Use the spreadsheet to perform the required calculations and hypothesis test.

Transcribed Image Text:E3
1
2
3
4
5
Excel template - Saved
6
7
12
13
14
15
16
17
File
8
9 Yes
10 No
11 Total
38
39
40
41
42
43
A
44
45
46
47
48
49
50
Yes
No
Total
18 Yes
19 No
20
21
22
23
24
25
26
27
28
29
30
31
32
33
34
35
36
37
Total
120
140
100
60
Chevrolet
80
Chevrolet
#N/A
#N/A
#N/A
40
Home
B
Chevrolet
20
0
70
55
Chevrolet (Y)
Insert
с
x ✓ fx
Observed
Ford
Arial
Ford
Expected
Ford
#N/A
#N/A
#N/A
Sheet1
125
75
D
+
Draw Page Layout
Honda
Honda
Honda
#N/A
#N/A
#N/A
Chevrolet (N)
126
49
✓ 10
E
Total
Total
Total
#N/A
#N/A
#N/A
F
Ford (Y)
Calculation Mode: Automatic Workbook Statistics
Yes
Yes
Yes
B
No
No
No
G
Formulas
Repurchase Frequencies (Observed vs. Expected)
↓
Observed Expected
O Search (Option + Q)
H
Data
Formulas
Chevy Impala
Ford Fusion
Chi-Square Computation
Observed Expected
Likely to Repurchase? Auto Owner Frequency Frequency Difference Difference^2
Yes
Yes
Chevy Impala
Ford Fusion
Honda Accord
Chevy Impala
Yes
No
No
Ford Fusion
No
Honda Accord
Honda Accord
Chevy Impala
Ford Fusion
Honda Accord
lili
Ford (N)
Honda (Y)
Review
#N/A
#N/A
#N/A
#N/A
#N/A
#N/A
Honda (N)
View Help
#N/A
#N/A
#N/A
#N/A
#N/A
#N/A
K
ab
#N/A
#N/A
#N/A
#N/A
#N/A
#N/A
L
Chi-square (2 decimals)
p-value (4 decimals)
alpha
Reject Null?
#N/A
#N/A
#N/A
#N/A
#N/A
#N/A
General
Chi-square
p-value
alpha
Reject Null?
M
Difference^2 / Expected
#N/A
#N/A
#N/A
#N/A
#N/A
#N/A
#N/A
#N/A
#N/A
←.0
.00
0.01
0.01
N
.00
→.0
O
Summary
Chevrolet (Y)
Chevrolet (N)
Ford (Y)
Ford (N)
Honda (Y)
Honda (N)
P
v
Q
Observed Expected
70
55
125
75
126
49
0
0
0
0
0
0
R
S
T
Ev
U
Editing
APV
V
Ov
Give Feedback to Microsoft
W
Comments
X
Y
>
70% +
Transcribed Image Text:a. Formulate a hypotheses that can be used to test for equal proportions of respondents who say they are willing (or not willing) to repurchase their current vehicle.
1. Ho P1 P2 ‡ P3
2. Ho P1 = P2 = P3
3. Ho P1 P2 = P3
Choose the correct answer from the list above.
2
Choose the correct alternative hypothesis:
All population proportions are not equal
b. Enter the values from the expected frequency table (to 2 decimals if necessary).
Yes
No
Total
Chevrolet Impala Ford Fusion Honda Accord Total
c. What is the value of the test statistic (to 2 decimals)?
d. What is the p-value (to 4 decimals)?
e. What is your conclusion at a = 0.01?
Concl
that the three makes tomobiles provide equal proportions consumer loyalty
Expert Solution
This question has been solved!
Explore an expertly crafted, step-by-step solution for a thorough understanding of key concepts.

Step by step
Solved in 3 steps with 1 images

Recommended textbooks for you
MATLAB: An Introduction with Applications
Statistics
ISBN:
9781119256830
Author:
Amos Gilat
Publisher:
John Wiley & Sons Inc

Probability and Statistics for Engineering and th…
Statistics
ISBN:
9781305251809
Author:
Jay L. Devore
Publisher:
Cengage Learning

Statistics for The Behavioral Sciences (MindTap C…
Statistics
ISBN:
9781305504912
Author:
Frederick J Gravetter, Larry B. Wallnau
Publisher:
Cengage Learning
MATLAB: An Introduction with Applications
Statistics
ISBN:
9781119256830
Author:
Amos Gilat
Publisher:
John Wiley & Sons Inc
Probability and Statistics for Engineering and th…
Statistics
ISBN:
9781305251809
Author:
Jay L. Devore
Publisher:
Cengage Learning
Statistics for The Behavioral Sciences (MindTap C…
Statistics
ISBN:
9781305504912
Author:
Frederick J Gravetter, Larry B. Wallnau
Publisher:
Cengage Learning

Elementary Statistics: Picturing the World (7th E…
Statistics
ISBN:
9780134683416
Author:
Ron Larson, Betsy Farber
Publisher:
PEARSON

The Basic Practice of Statistics
Statistics
ISBN:
9781319042578
Author:
David S. Moore, William I. Notz, Michael A. Fligner
Publisher:
W. H. Freeman

Introduction to the Practice of Statistics
Statistics
ISBN:
9781319013387
Author:
David S. Moore, George P. McCabe, Bruce A. Craig
Publisher:
W. H. Freeman