a. Gross profit margin. b. Operating profit margin. c. Net profit margin. d. Return on shareholders' equity. e. Net Return on assets. f. Times-interest-earned (or coverage) ratio. g. Debt-to-equity ratio. h. Days of inventory. i. Inventory turnover ratio. j. Average collection period. a. b. C. d. e. f. 9. h. Ratios Gross profit margin (%) Operating profit margin (%) Net profit margin (%) Return on shareholders equity (%) Return on assets (%) Times interest earned coverage Debt-to-Equity Ratio Days of Inventory 2019 39.0 7.0 2018
a. Gross profit margin. b. Operating profit margin. c. Net profit margin. d. Return on shareholders' equity. e. Net Return on assets. f. Times-interest-earned (or coverage) ratio. g. Debt-to-equity ratio. h. Days of inventory. i. Inventory turnover ratio. j. Average collection period. a. b. C. d. e. f. 9. h. Ratios Gross profit margin (%) Operating profit margin (%) Net profit margin (%) Return on shareholders equity (%) Return on assets (%) Times interest earned coverage Debt-to-Equity Ratio Days of Inventory 2019 39.0 7.0 2018

Intermediate Accounting: Reporting And Analysis
3rd Edition
ISBN:9781337788281
Author:James M. Wahlen, Jefferson P. Jones, Donald Pagach
Publisher:James M. Wahlen, Jefferson P. Jones, Donald Pagach
Chapter5: The Income Statement And The Statement Of Cash Flows
Section: Chapter Questions
Problem 7E: Multiple-Step and Single-Step Income Statements, and Statement of Comprehensive Income On December...

Related questions
Question
Transcribed Image Text:tx
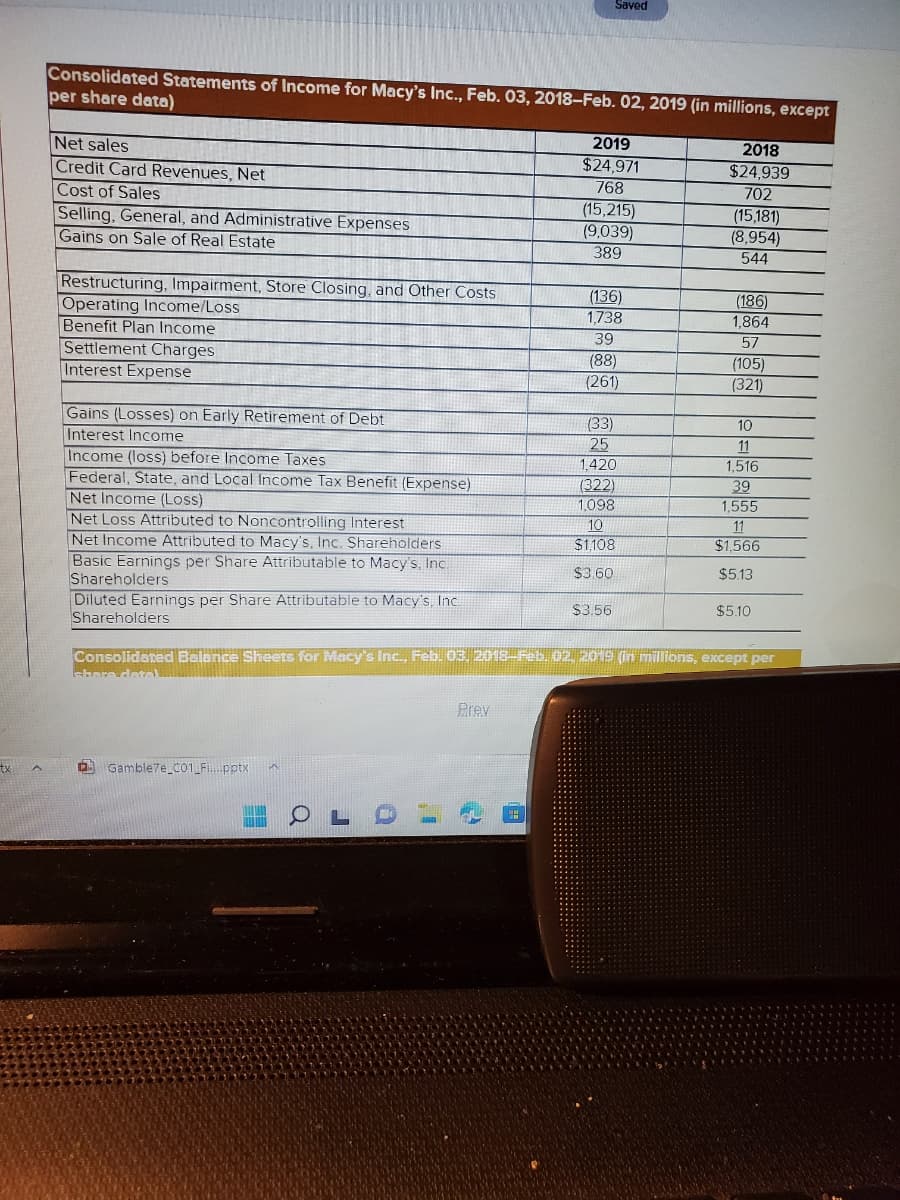
Consolidated Statements of Income for Macy's Inc., Feb. 03, 2018-Feb. 02, 2019 (in millions, except
per share data)
Net sales
Credit Card Revenues, Net
Cost of Sales
Selling, General, and Administrative Expenses
Gains on Sale of Real Estate
Restructuring, Impairment, Store Closing, and Other Costs
Operating Income/Loss
Benefit Plan Income
Settlement Charges
Interest Expense
Gains (Losses) on Early Retirement of Debt
Interest Income
Income (loss) before Income Taxes
Federal, State, and Local Income Tax Benefit (Expense)
Net Income (Loss)
Net Loss Attributed to Noncontrolling Interest
Net Income Attributed to Macy's, Inc. Shareholders
Basic Earnings per Share Attributable to Macy's, Inc.
Shareholders
Diluted Earnings per Share Attributable to Macy's, Inc.
Shareholders
Gamble7e_C01 Fi....pptx PS
OLI
Prev
ww
UM
Saved
2019
$24,971
768
(15,215)
(9,039)
389
(136)
1,738
39
(88)
(261)
(33)
25
1.420
(322)
1.098
10
$1.108
$3,60
$3.56
2018
$24.939
702
(15,181)
(8,954)
544
Consolidated Balance Sheets for Macy's Inc., Feb. 03. 2018-Feb. 02, 2019 (in millions, except per
share datel
(186)
1,864
57
(105)
(321)
10
11
1,516
39
1,555
11
$1,566
$5.13
$5.10
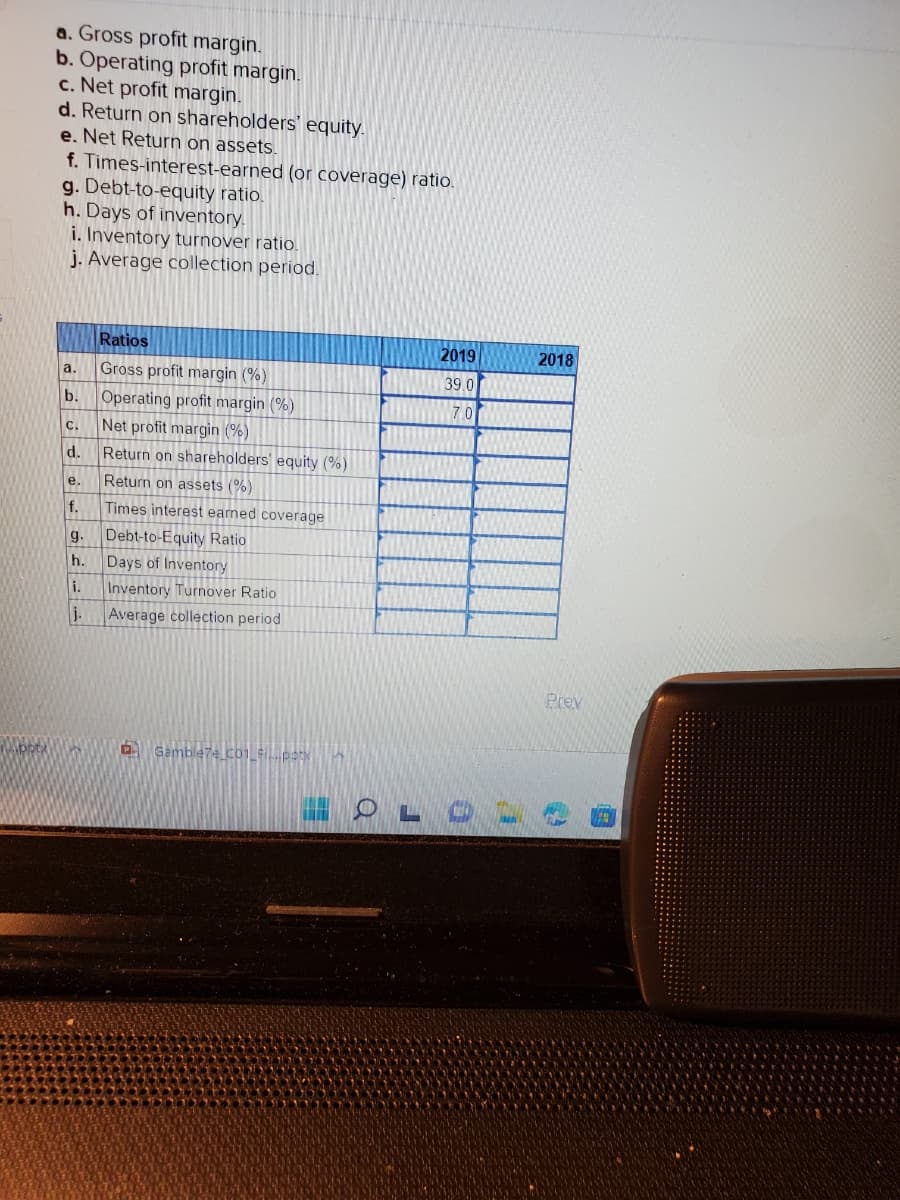
Transcribed Image Text:a. Gross profit margin.
b. Operating profit margin.
c. Net profit margin.
d. Return on shareholders' equity.
e. Net Return on assets.
f. Times-interest-earned (or coverage) ratio.
g. Debt-to-equity ratio.
h. Days of inventory.
i. Inventory turnover ratio.
j. Average collection period.
a.
b.
C.
d.
e.
f.
g.
h.
i.
J.
Ratios
Gross profit margin (%)
Operating profit margin (%)
Net profit margin (%)
Return on shareholders' equity (%)
Return on assets (%)
Times interest earned coverage
Debt-to-Equity Ratio
Days of Inventory
Inventory Turnover Ratio
Average collection period
Gamblere Co1_fi...patx 3
2019
39.0
7.0
LO
2018
Prev
Expert Solution
This question has been solved!
Explore an expertly crafted, step-by-step solution for a thorough understanding of key concepts.

Step by step
Solved in 2 steps with 2 images

Knowledge Booster


Learn more about
Need a deep-dive on the concept behind this application? Look no further. Learn more about this topic, accounting and related others by exploring similar questions and additional content below.Recommended textbooks for you
Intermediate Accounting: Reporting And Analysis
Accounting
ISBN:
9781337788281
Author:
James M. Wahlen, Jefferson P. Jones, Donald Pagach
Publisher:
Cengage Learning

Financial Accounting: The Impact on Decision Make…
Accounting
ISBN:
9781305654174
Author:
Gary A. Porter, Curtis L. Norton
Publisher:
Cengage Learning

Fundamentals Of Financial Management, Concise Edi…
Finance
ISBN:
9781337902571
Author:
Eugene F. Brigham, Joel F. Houston
Publisher:
Cengage Learning
Intermediate Accounting: Reporting And Analysis
Accounting
ISBN:
9781337788281
Author:
James M. Wahlen, Jefferson P. Jones, Donald Pagach
Publisher:
Cengage Learning
Financial Accounting: The Impact on Decision Make…
Accounting
ISBN:
9781305654174
Author:
Gary A. Porter, Curtis L. Norton
Publisher:
Cengage Learning
Fundamentals Of Financial Management, Concise Edi…
Finance
ISBN:
9781337902571
Author:
Eugene F. Brigham, Joel F. Houston
Publisher:
Cengage Learning

Century 21 Accounting Multicolumn Journal
Accounting
ISBN:
9781337679503
Author:
Gilbertson
Publisher:
Cengage

Cornerstones of Financial Accounting
Accounting
ISBN:
9781337690881
Author:
Jay Rich, Jeff Jones
Publisher:
Cengage Learning

Financial Accounting
Accounting
ISBN:
9781337272124
Author:
Carl Warren, James M. Reeve, Jonathan Duchac
Publisher:
Cengage Learning