a. How many variables are in the dataset? What are they? b. Which variables are quantitative and which are categorical? c. What type of measurement scale is used for each variable?
a. How many variables are in the dataset? What are they? b. Which variables are quantitative and which are categorical? c. What type of measurement scale is used for each variable?

Glencoe Algebra 1, Student Edition, 9780079039897, 0079039898, 2018
18th Edition
ISBN:9780079039897
Author:Carter
Publisher:Carter
Chapter10: Statistics
Section10.6: Summarizing Categorical Data
Problem 27PPS

Related questions
Question
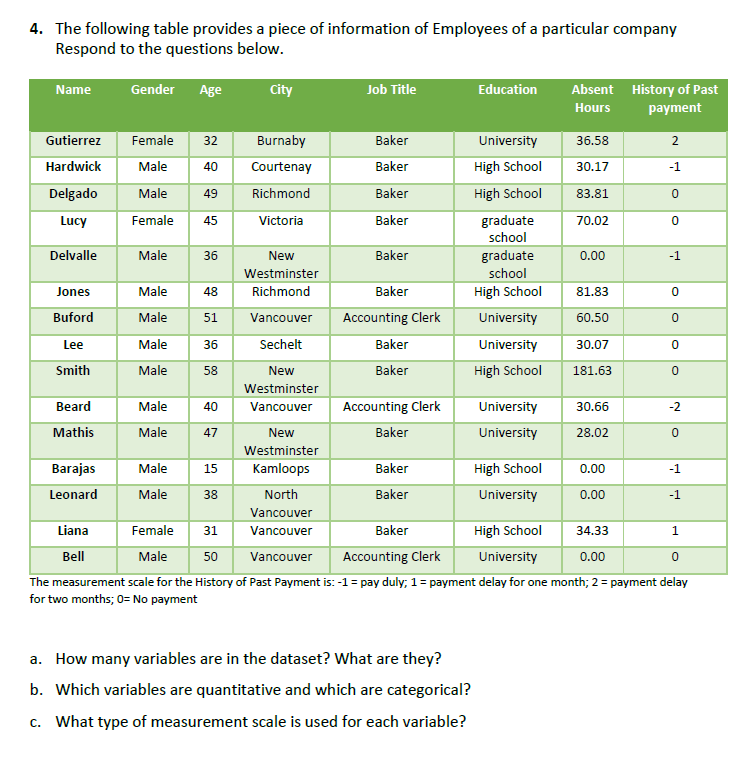
Transcribed Image Text:4. The following table provides a piece of information of Employees of a particular company
Respond to the questions below.
Name
Gender
Аge
City
Job Title
Education
Absent History of Past
Hours
payment
Gutierrez
Female
32
Burnaby
Baker
University
36.58
2
Hardwick
Male
40
Courtenay
Baker
High School
30.17
-1
Delgado
Male
49
Richmond
Baker
High School
83.81
Female
Baker
graduate
school
Lucy
45
Victoria
70.02
Delvalle
Male
36
New
Baker
graduate
0.00
-1
Westminster
school
Jones
Male
48
Richmond
Baker
High School
81.83
Buford
Male
51
Vancouver
Accounting Clerk
University
60.50
Lee
Male
36
Sechelt
Baker
University
30.07
Smith
Male
58
New
Baker
High School
181.63
Westminster
Beard
Male
40
Vancouver
Accounting Clerk
University
30.66
-2
Mathis
Male
47
New
Baker
University
28.02
Westminster
Barajas
Male
15
Kamloops
Baker
High School
0.00
-1
Leonard
Male
38
North
Baker
University
0.00
-1
Vancouver
Female 31
Liana
Vancouver
Baker
High School
34.33
Bell
Male
50
Vancouver
Accounting Clerk
University
0.00
The measurement scale for the History of Past Payment is: -1= pay duly; 1= payment delay for one month; 2 = payment delay
for two months; 0= No payment
a. How many variables are in the dataset? What are they?
b. Which variables are quantitative and which are categorical?
c. What type of measurement scale is used for each variable?
Expert Solution
This question has been solved!
Explore an expertly crafted, step-by-step solution for a thorough understanding of key concepts.

Step by step
Solved in 2 steps

Recommended textbooks for you
Glencoe Algebra 1, Student Edition, 9780079039897…
Algebra
ISBN:
9780079039897
Author:
Carter
Publisher:
McGraw Hill
Glencoe Algebra 1, Student Edition, 9780079039897…
Algebra
ISBN:
9780079039897
Author:
Carter
Publisher:
McGraw Hill