A. The average cost per household of owning a brand new car is 5,000. Suppose that we randomly selected 40 households. Determine the probability that the sample mean for these 40 households is more than 5,350? Assume the variable is normally distributed and the standard deviation is 1,230.
A. The average cost per household of owning a brand new car is 5,000. Suppose that we randomly selected 40 households. Determine the probability that the sample mean for these 40 households is more than 5,350? Assume the variable is normally distributed and the standard deviation is 1,230.

MATLAB: An Introduction with Applications
6th Edition
ISBN:9781119256830
Author:Amos Gilat
Publisher:Amos Gilat
Chapter1: Starting With Matlab
Section: Chapter Questions
Problem 1P

Related questions

Question
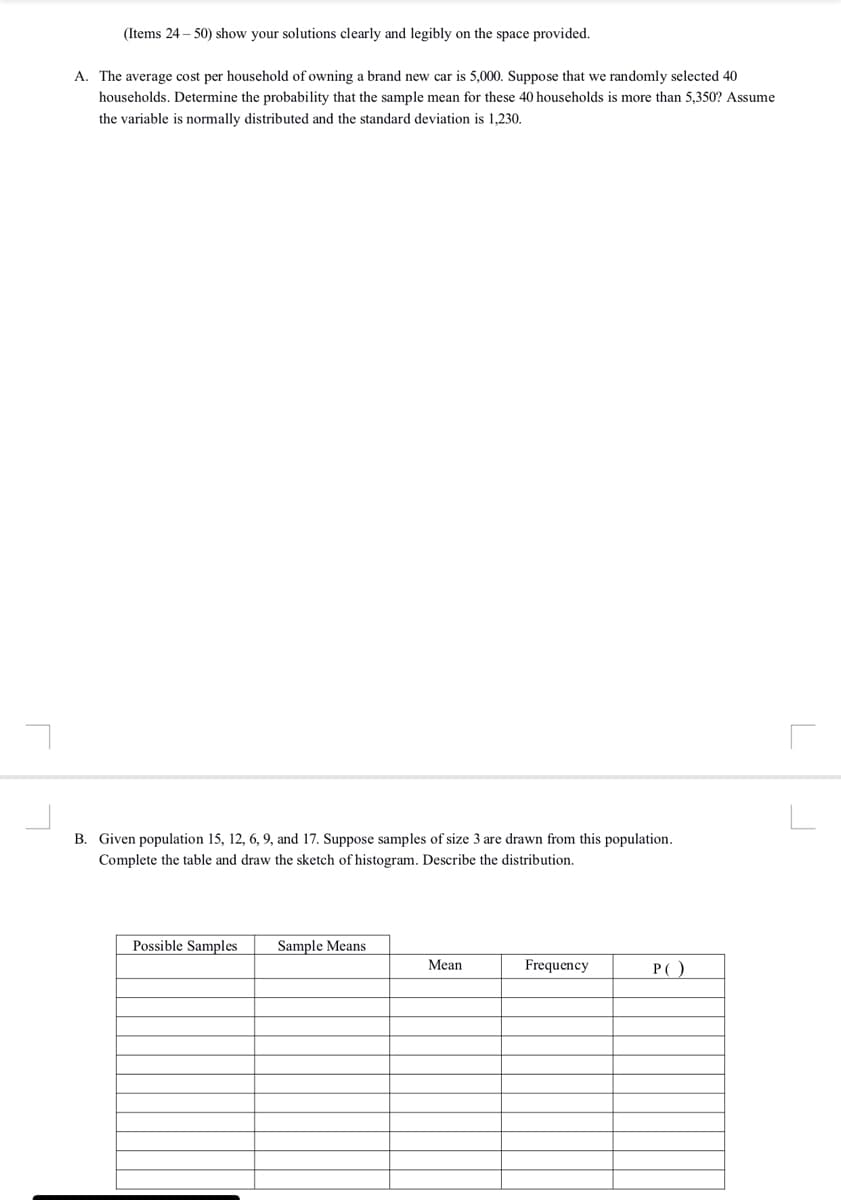
Transcribed Image Text:(Items 24 – 50) show your solutions clearly and legibly
the space provided.
A. The average cost per household of owning a brand new car is 5,000. Suppose that we randomly selected 40
households. Determine the probability that the sample mean for these 40 households is more than 5,350? Assume
the variable is normally distributed and the standard deviation is 1,230.
B. Given population 15, 12, 6, 9, and 17. Suppose samples of size 3 are drawn from this population.
Complete the table and draw the sketch of histogram. Describe the distribution.
Possible Samples
Sample Means
Mean
Frequency
P()
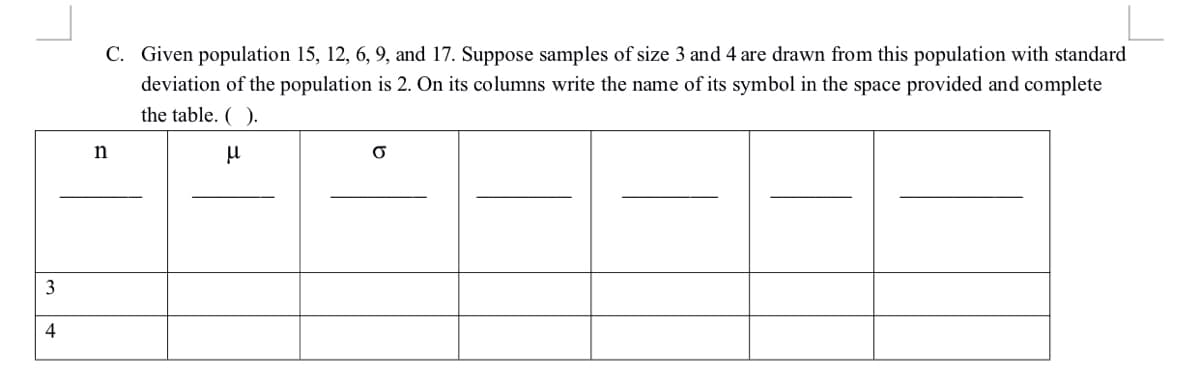
Transcribed Image Text:C. Given population 15, 12, 6, 9, and 17. Suppose samples of size 3 and 4 are drawn from this population with standard
deviation of the population is 2. On its columns write the name of its symbol in the space provided and complete
the table. ( ).
3
4
Expert Solution
This question has been solved!
Explore an expertly crafted, step-by-step solution for a thorough understanding of key concepts.

Step by step
Solved in 2 steps

Knowledge Booster


Learn more about
Need a deep-dive on the concept behind this application? Look no further. Learn more about this topic, statistics and related others by exploring similar questions and additional content below.Recommended textbooks for you
MATLAB: An Introduction with Applications
Statistics
ISBN:
9781119256830
Author:
Amos Gilat
Publisher:
John Wiley & Sons Inc

Probability and Statistics for Engineering and th…
Statistics
ISBN:
9781305251809
Author:
Jay L. Devore
Publisher:
Cengage Learning

Statistics for The Behavioral Sciences (MindTap C…
Statistics
ISBN:
9781305504912
Author:
Frederick J Gravetter, Larry B. Wallnau
Publisher:
Cengage Learning
MATLAB: An Introduction with Applications
Statistics
ISBN:
9781119256830
Author:
Amos Gilat
Publisher:
John Wiley & Sons Inc
Probability and Statistics for Engineering and th…
Statistics
ISBN:
9781305251809
Author:
Jay L. Devore
Publisher:
Cengage Learning
Statistics for The Behavioral Sciences (MindTap C…
Statistics
ISBN:
9781305504912
Author:
Frederick J Gravetter, Larry B. Wallnau
Publisher:
Cengage Learning

Elementary Statistics: Picturing the World (7th E…
Statistics
ISBN:
9780134683416
Author:
Ron Larson, Betsy Farber
Publisher:
PEARSON

The Basic Practice of Statistics
Statistics
ISBN:
9781319042578
Author:
David S. Moore, William I. Notz, Michael A. Fligner
Publisher:
W. H. Freeman

Introduction to the Practice of Statistics
Statistics
ISBN:
9781319013387
Author:
David S. Moore, George P. McCabe, Bruce A. Craig
Publisher:
W. H. Freeman