A. Using the following information and the GRAPH VII (following page): 1) Graph the Budget Constraint line that corresponds to a Total income of $3,200; with the price of Good Y = $20.00/unit and the price of Good X = $9.41. (Label this Budget Constraint as BC1). 2) What is the highest level of utility achievable from this Budget Constraint? (i.e. TU = 3) For the Budget Constraint Bc1, identify/quantify and label the "utility-maximizing" consumption amounts of Good X and Good Y.
A. Using the following information and the GRAPH VII (following page): 1) Graph the Budget Constraint line that corresponds to a Total income of $3,200; with the price of Good Y = $20.00/unit and the price of Good X = $9.41. (Label this Budget Constraint as BC1). 2) What is the highest level of utility achievable from this Budget Constraint? (i.e. TU = 3) For the Budget Constraint Bc1, identify/quantify and label the "utility-maximizing" consumption amounts of Good X and Good Y.

Algebra for College Students
10th Edition
ISBN:9781285195780
Author:Jerome E. Kaufmann, Karen L. Schwitters
Publisher:Jerome E. Kaufmann, Karen L. Schwitters
Chapter13: Conic Sections
Section13.5: Systems Involving Nonlinear Equations
Problem 41PS

Related questions
Question
1
Transcribed Image Text:GRAPH
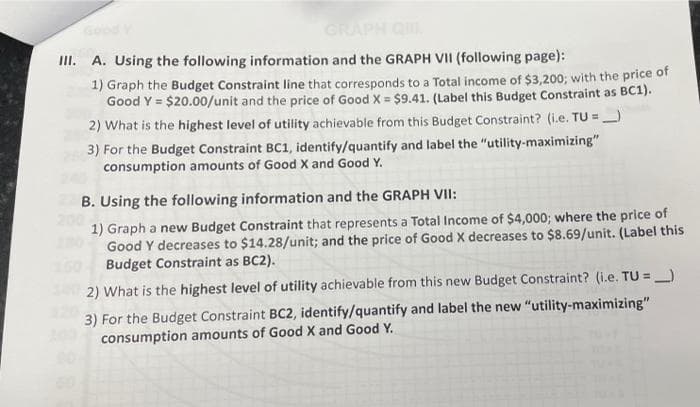
III. A. Using the following information and the GRAPH VII (following page):
1) Graph the Budget Constraint line that corresponds to a Total income of $3,200; with the price of
Good Y = $20.00/unit and the price of Good X = $9.41. (Label this Budget Constraint as BC1).
%3!
2) What is the highest level of utility achievable from this Budget Constraint? (i.e. TU =
3) For the Budget Constraint BC1, identify/quantify and label the "utility-maximizing"
consumption amounts of Good X and Good Y.
B. Using the following information and the GRAPH VII:
1) Graph a new Budget Constraint that represents a Total Income of $4,000; where the price of
Good Y decreases to $14.28/unit; and the price of Good X decreases to $8.69/unit. (Label this
Budget Constraint as BC2).
2) What is the highest level of utility achievable from this new Budget Constraint? (i.e. TU =)
%3D
3) For the Budget Constraint BC2, identify/quantify and label the new "utility-maximizing"
consumption amounts of Good X and Good Y.
Expert Solution
This question has been solved!
Explore an expertly crafted, step-by-step solution for a thorough understanding of key concepts.

This is a popular solution!

Trending now
This is a popular solution!

Step by step
Solved in 2 steps with 1 images

Recommended textbooks for you
Algebra for College Students
Algebra
ISBN:
9781285195780
Author:
Jerome E. Kaufmann, Karen L. Schwitters
Publisher:
Cengage Learning

College Algebra (MindTap Course List)
Algebra
ISBN:
9781305652231
Author:
R. David Gustafson, Jeff Hughes
Publisher:
Cengage Learning
Algebra for College Students
Algebra
ISBN:
9781285195780
Author:
Jerome E. Kaufmann, Karen L. Schwitters
Publisher:
Cengage Learning
College Algebra (MindTap Course List)
Algebra
ISBN:
9781305652231
Author:
R. David Gustafson, Jeff Hughes
Publisher:
Cengage Learning