a. Which is the independent variable? b. What is the level of measurement for the independent variable and the dependent variable? c. How would you describe the relationship between the two variables? Use percentages in your answer.
a. Which is the independent variable? b. What is the level of measurement for the independent variable and the dependent variable? c. How would you describe the relationship between the two variables? Use percentages in your answer.

Glencoe Algebra 1, Student Edition, 9780079039897, 0079039898, 2018
18th Edition
ISBN:9780079039897
Author:Carter
Publisher:Carter
Chapter10: Statistics
Section10.3: Measures Of Spread
Problem 1GP

Related questions
Question
100%
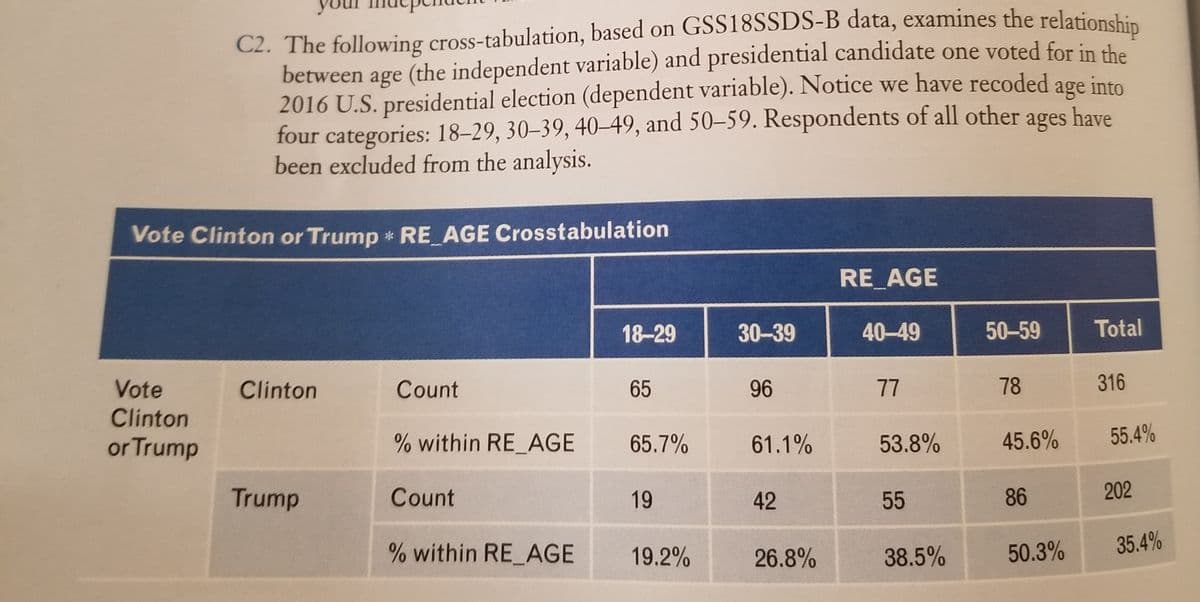
Transcribed Image Text:C2. The following cross-tabulation, based on GSS18SSDS-B data, examines the relationmchia
between age (the independent variable) and presidential candidate one voted for in the
2016 U.S. presidential election (dependent variable). Notice we have recoded age into
four categories: 18–29, 30–39, 40–49, and 50–59. Respondents of all other ages have
been excluded from the analysis.
your
ages
Vote Clinton or Trump * RE AGE Crosstabulation
RE AGE
18-29
30-39
40-49
50-59
Total
Vote
Clinton
Count
65
96
77
78
316
Clinton
or Trump
% within RE_AGE
65.7%
61.1%
53.8%
45.6%
55.4%
Trump
Count
19
42
55
86
202
% within RE_AGE
19.2%
26.8%
38.5%
50.3%
35.4%
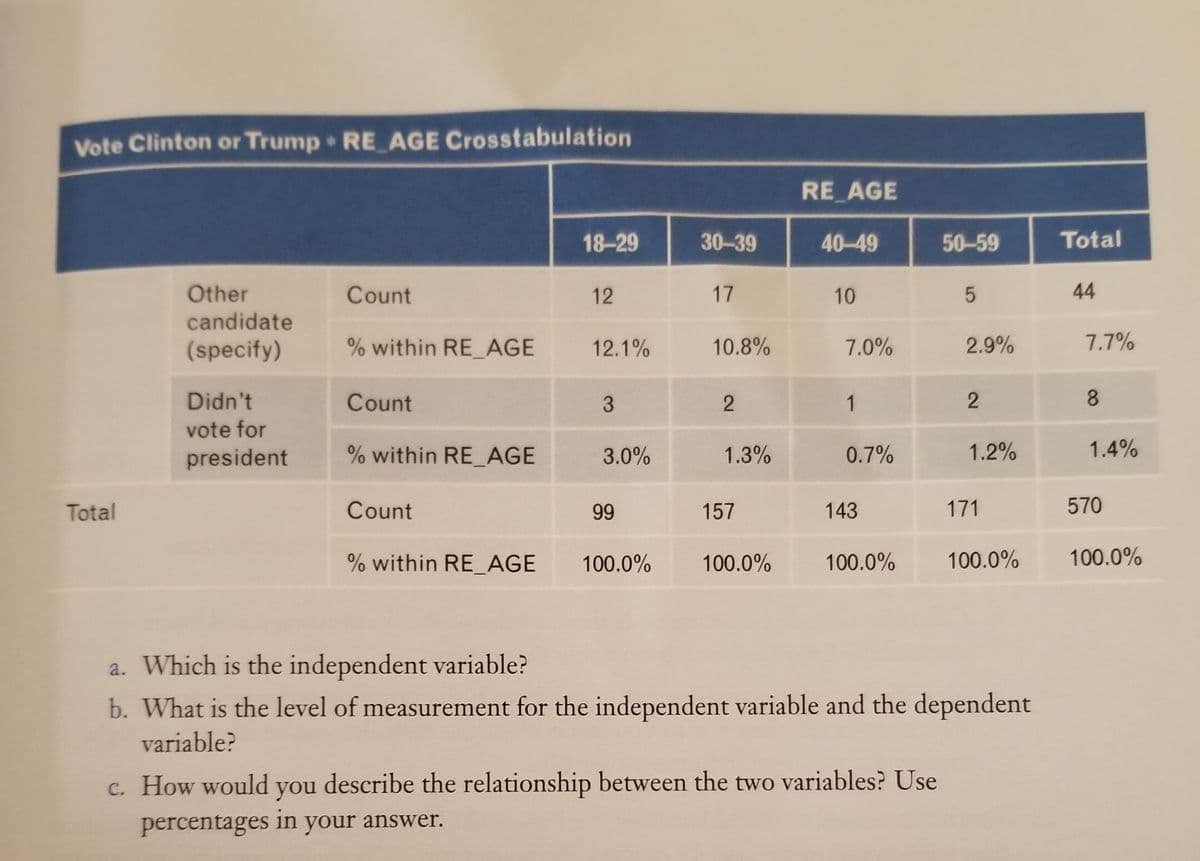
Transcribed Image Text:Vote Clinton or Trump RE AGE Crosstabulation
RE AGE
18-29
30-39
40-49
50-59
Total
Other
Count
12
17
10
44
candidate
(specify)
% within RE_AGE
12.1%
10.8%
7.0%
2.9%
7.7%
Didn't
Count
1
8.
vote for
president
% within RE_AGE
3.0%
1.3%
0.7%
1.2%
1.4%
Total
Count
99
157
143
171
570
% within RE_AGE
100.0%
100.0%
100.0%
100.0%
100.0%
a. Which is the independent variable?
b. What is the level of measurement for the independent variable and the dependent
variable?
c. How would you describe the relationship between the two variables? Use
percentages your answer.
in
Expert Solution
This question has been solved!
Explore an expertly crafted, step-by-step solution for a thorough understanding of key concepts.

This is a popular solution!

Trending now
This is a popular solution!

Step by step
Solved in 3 steps

Recommended textbooks for you
Glencoe Algebra 1, Student Edition, 9780079039897…
Algebra
ISBN:
9780079039897
Author:
Carter
Publisher:
McGraw Hill

Holt Mcdougal Larson Pre-algebra: Student Edition…
Algebra
ISBN:
9780547587776
Author:
HOLT MCDOUGAL
Publisher:
HOLT MCDOUGAL
Glencoe Algebra 1, Student Edition, 9780079039897…
Algebra
ISBN:
9780079039897
Author:
Carter
Publisher:
McGraw Hill
Holt Mcdougal Larson Pre-algebra: Student Edition…
Algebra
ISBN:
9780547587776
Author:
HOLT MCDOUGAL
Publisher:
HOLT MCDOUGAL