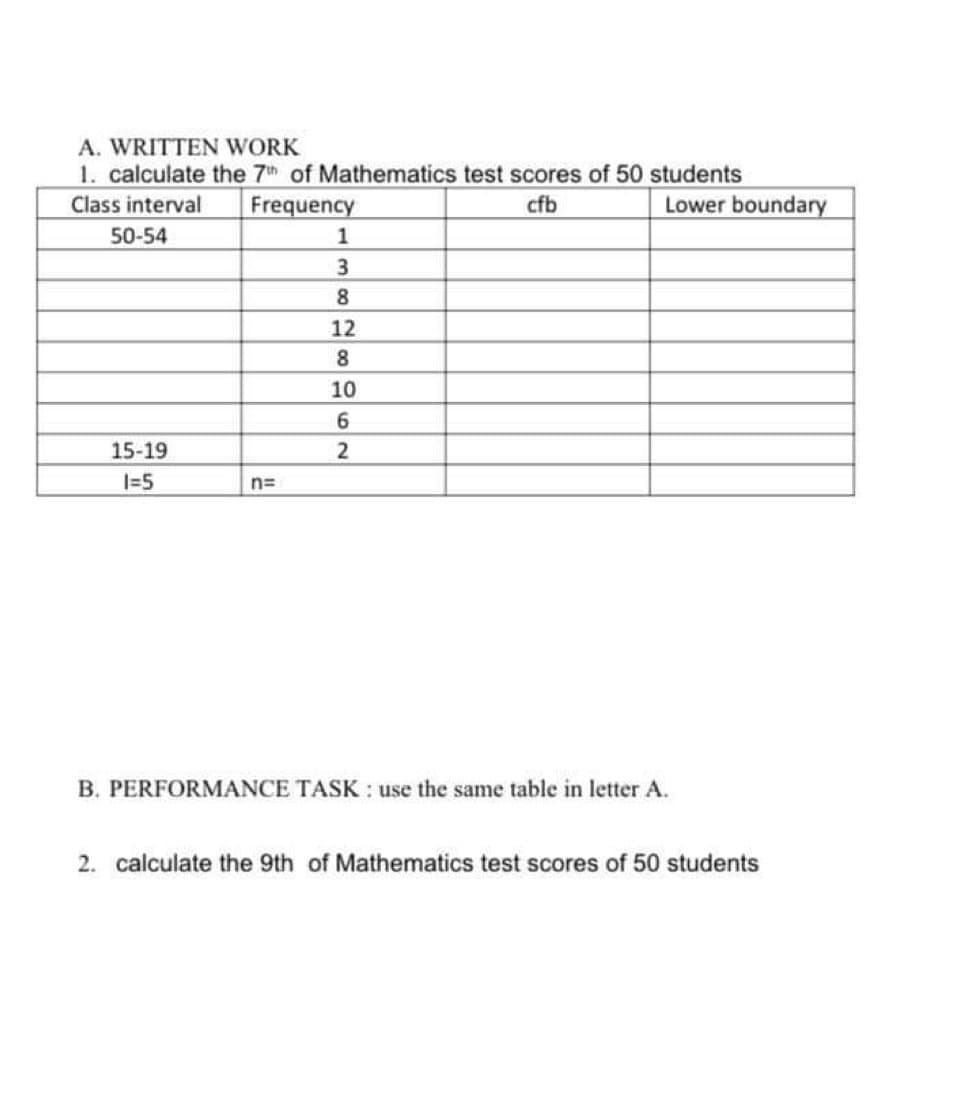
A. WRITTEN WORK 1. calculate the 7th of Mathematics test scores of 50 students Class interval Frequency cfb Lower boundary 50-54 1 8 12 8 10 15-19 I=5 n= B. PERFORMANCE TASK : use the same table in letter A. 2. calculate the 9th of Mathematics test scores of 50 students


Q: An airline is trying two new boarding procedures, Option 1 and Option 2, to load passengers onto…
A: Solution: Given information: Option 1 sample statistic are n1= 265 x1 = 17.6 s1= 4.7Option 2 sample…
Q: For the standard normal distribution shown on the right, find the probability of z occurring in the…
A: Let Z be the random variable standard normal distribution with mean = 0 and standard deviation = 1
Q: The owner of a chain of mini-markets wants to compare the sales performance of two of her stores,…
A: There are two independent samples which are Store 1 and Store 2. We have to test whether the mean…
Q: According to Census data, in 1960 the population of the U.S amounted to 151.3 million persons, and…
A: The objective is to interpret the shifted population in the West from 1960 to 2000 in terms of…
Q: A group of researchers are working to determine the historic sea levels of the body of water. They…
A: Given data Age(nearest thousand) micrometers 95…
Q: allup poll asks respondents how they would rate the honesty and ethical standards of people in…
A: In the given problem, it is given that the The proportion of respondents who gave a rating for a…
Q: Many investors and financial analysts believe the Dow Jones Industrial Average (DJIA) gives a good…
A: Given data number of success , x= 19 sample size, n =75 population proportion,p= 0.3
Q: A researcher is wondering whether the drinking habits of adults in a certain region of a country are…
A: Are the conditions for one proportion z test satisfied? If not, choosethe condition that is not…
Q: The following boxplots represent the estimates of the lifespan of an elephant (in years) given by 11…
A:
Q: Suppose two sections of the same class take the same exam and produce the results shown in the…
A: The relative frequency distribution of section 1 scores and section 2 scores, are given.
Q: One hundred draws will be made at random with replacement from a box with four tickets: 2, 4, 6, 8.…
A: Given that: One hundred draws will be made at random with replacement from a box with four tickets:…
Q: Let A and B be two events such that P (A) = 0.78 and P(B) = 0.01. %3D Do not round your responses.…
A: From the provided information, A and B be two events. P (A) = 0.78 and P (B) = 0.01
Q: A fair die is rolled 36 times. If there are 5 aces (one dot), that means the observed percentage of…
A:
Q: Problem 9.11 relates to Work Cells After an extensive product analysis using group tech- •• 9.11…
A:
Q: For which of the following situations would a repeated-measures research design be appropriate?…
A: Repeated measures research designs are used when the same subjects are observed under different…
Q: A researcher is interested in comparing the smoking rates of people living in Germany versus people…
A: Given: Sample size n=50 The 99% confidence interval for the difference in proportion of smokers in…
Q: The boxplots below represent movie runtimes (the length of a movie in minutes) for a random sample…
A: The given boxplots represent movie runtimes for a random sample of 100 movies in each of the four…
Q: Jse the following informatio The data below displays heights (in inches) of a random sample of…
A: Solution:- from given information let μs be the studentlet μpbe the parentdifference =s-p
Q: Shoppers were asked about their regular grocery shopping locations. The table below shows the…
A: The image is attached below,
Q: In 1970, 590 students among 1000 randomly selected college freshmen thought that capital punishment…
A: According to the given information in this question We need to find the value of two sample z test…
Q: A student collected a sample of 50 individuals' heights. He mistakenly recorded the tallest…
A: A student collected a sample of 50 individuals' heights. He mistakenly recorded the tallest…
Q: 5) Please answer the question and show your work in the space provided. Medhavi suspects that there…
A: The question is based on a regression model Given reg. eq. : GPA = 3.8 - 0.005 ( Text sent )
Q: A large group of people get together. Each one rolls a die 180 times, and counts the number of aces…
A: A large group of people get together. Each one rolls a die 180 times.
Q: In a study, a large sample representative of the female population in the US were asked whether they…
A: Research Design: The structure of the market research methodology chosen by a researcher is referred…
Q: In each of the following settings, decide whether you should use two-sample z procedures for a…
A: When the population is larger and they can't be compared easily and hence sample is taken from the…
Q: Fathers and eldest Sons I. Q's. The/table below shows the respective I. Q's of 10 fathers and their…
A: For the given data, we need to find the rank correlation coefficient.
Q: A poll of 2625 U.S. adults found that 1240 U.S. adults, or 47.238% regularly used Facebook as a news…
A: Solution: Given information: n= 2625 Sample size p^= 0.47238 Sample proportion
Q: A large group of people get together. Each one rolls a die 180 times, and counts the number of aces…
A: A large group of people get together. Each one rolls a die 180 times
Q: What is the test statistic for this sample? (Report answer accurate to three decimal places.) test…
A: Given data number of success , x= 63 sample size, n =158 population proportion,p= 0.37…
Q: Morgan's Mediterranean Restaurant has found that the number of falafel plates sold can be modeled by…
A: Given Y=1.8x + 9.2
Q: UTM 4. An average of 35 fish per day enter the intake pipe of a water treatment plant. A hydraulic…
A:
Q: Jsing the latest in medical technology, an orthopedic doctor has developed a new surgical procedure…
A: The provided information is x¯1=380.4, x¯2=424.8s12=3189.7, s22=469.2n1=11, n2=9α=0.05 s1=56.47,…
Q: new drug is designed to reduce a person's blood pressure. Eight randomly selected hypertensive…
A:
Q: Find the indicated z-score shown in the graph. Left Area is shaded in blue. Area = 0.1949 z= ?0 The…
A: Given z=0.1949
Q: Norman is performing a hypothesis test in which he rejects the null hypothesis at a significance…
A: Norman is performing a hypothesis test in which he rejects the null hypothesis at a significance…
Q: A Moving to another question will save this response. Find the value of the linear correlation…
A: Correlation Coefficient is a denoted by r
Q: True or false If the p-value for a hypothesis test is greater than O.01, we fail to reject the null…
A: Solution:- given if the p-value for a hypothesis test is greater than 0.01, we fail to reject the…
Q: The number of meteors found by a radar system in any 30-second interval under specified conditions…
A: Let X denotes the number of meteors found by a radar follows Poisson distribution with rate λ=1.81…
Q: midterm score in a large statistics class was 65 with an SD of 15. The average final score in the…
A:
Q: Provide an appropriate response. In a pizza takeout restaurant, the following probability…
A: Formula : Variance :
Q: The ages (in years) of 21 people are listed below: 15 18 18 19 22 23 24 24 24 24 25 26 26 27 28 28…
A: An outlier is any data point more than 1.5 interquartile range as below the first quartile or above…
Q: THE CRITICAL VALUE FOR TWO TAILED TEST AT 5% LEVEL OF SIGNIFICANCE IS
A:
Q: Calculate the approximate proportion of house prices that fall between $1,000,000 and $2,000,00C…
A: The relative frequency histogram of house prices is given.
Q: A simple random sample of 1000 people age 18 or over is taken in a large town. It turns out that 332…
A:
Q: Perform a two-tailed test. Then complete the parts below. Carry your intermediate computations to…
A: Use the Two sample independent t test Sample Mean 36.41 Standard Deviation (S1)…
Q: Four scenarios of statistical studies are given below. Decide which study uses a sample statistic. O…
A: The set or collection of all possible observations is defined as the population.
Q: Provide an appropriate response. Determine the probability distribution's missing value. The…
A: sum of all probability is equals to 1.
Q: Expenditure on Food when that on Accommodation is Known. To study the relationship between…
A: Given that, to study the relationship between Expenditure on Accommodation, $x and Expenditure on…
Q: The sample mean is 8.25 The sample variance is. (Simplify your answer. Round to two decimals as…
A: We have given that the data 5, 7, 9, 12 The sample mean is 8.25
Q: A purchasing manager for a large university is investigating which brand of LCD projector to…
A: There are two independent samples which are In focus and Proxima. We have to test whether the mean…

Step by step
Solved in 2 steps

- Describe the procedure of fitting aregression line through nonacross approach nonparametric if z is parallel to procedure? What adjustments have to be made in W,Z,Y if the ties occur within Z samples and across the Y samples?As an industrial engineer is working a test of material used to on a certain product to determine whether it is more economical to repair a damaged area rather than replace the entire structure. The engineer obtained the following data on the bond length (x variable) vs. the rupture load (y variable) Bond Length (mm) Rupture Load (N) 50 17,052 50 14,063 80 26,264 80 19,600 110 21,952 110 26,362 140 26,362 140 26,754 170 31,654 170 32,928 Find the 95% Confidence Interval for the conditional mean of the response variable at x = 140The results of an independent-measures research study are reported as "t(20) = 2.12, p < .05, two tails." For this study, what t values formed the boundaries for the critical region?
- Fill out the table giving the joint and marginal PMFs for X and Y. Find E[X] and E[Y]. Find the covariance of X and Y. Are X and Y independent?Samples are collected from the River X and pH values are observed. 9 different pH values are listed in table 3. Table 3 Concentrations 3.55 4.01 5.38 3.22 8.05 5.25 4.67 3.67 3.5Draw box plot and find a. Bowley’s coefficient of skewness b. Karl Pearson’s coefficient of skewness c. Third moment Rubric Stages of Process Marks Imagine and Plan 2Composition 2Effort 1The data given is shown below 40 40 43 46 44 49 51 54 46 51 47 49 49 45 45 44 45 41 49 52 51 54 50 51 41 52 53 50 46 56 42 42 40 42 49 47 51 48 46 57 48 55 49 46 57 44 49 43 44 43 51 48 48 46 49 Class width = 6 Find the following: A. Decile (5th) B. Quartile (2nd) C. Skewness D. Kurtosis
- In the article “Groundwater Electromagnetic Imaging in Complex Geological and Topographical Regions: A Case Study of a Tectonic Boundary in the French Alps” (S. Houtot, P. Tarits, et al., Geophysics, 2002:1048–1060), the pH was measured for several water samples in various locations near Gittaz Lake in the French Alps. The results for 11 locations on the northern side of the lake and for 6 locations on the southern side are as follows: Northern side: 8.1 8.2 8.1 8.2 8.2 7.4 7.3 7.4 8.1 8.1 7.9 Southern side: 7.8 8.2 7.9 7.9 8.1 8.1 Find a 98% confidence interval for the difference in pH between the northern and southern side.Given are the data for two variables x and y. xi 6 11 15 18 20 yi 6 8 12 20 30 D. Compute the standard residuals. Enter negative valies as negative numbers. 1. ? 2 ? (To 4 decimal places) 3. ? (To 4 decimal places) 4 ? (To 4 decimal places) 5 ? (To 4 decimal places) Thank you2- An expert estimates that the distribution parameter for durability times of parts produced with machine A in the factory is different from the distribution parameter for durability times of parts produced with machine B. Durability times of 4 parts produced from machine A and 4 parts produced from machine B are given below. Find the Mann-Whitney U value by using these data. a) 18 B) 6 NS) 16 D) 20 TO) 12
- The article “Effect of Varying Solids Concentration and Organic Loading on the Performance of Temperature Phased Anaerobic Digestion Process” (S. Vandenburgh and T. Ellis, Water Environment Research, 2002:142–148) discusses experiments to determine the effect of the solids concentration on the performance of treatment methods for wastewater sludge. In the first experiment, the concentration of solids (in g/L) was 43.94 ± 1.18. In the second experiment, which was independent of the first, the concentration was 48.66 ± 1.76. Estimate the difference in the concentration between the two experiments, and find the uncertainty in the estimate.The accompanying specific gravity values for variouswood types used in construction appeared in the article“Bolted Connection Design Values Based on EuropeanYield Model” (J. of Structural Engr., 1993: 2169–2186):.31 .35 .36 .36 .37 .38 .40 .40 .40.41 .41 .42 .42 .42 .42 .42 .43 .44.45 .46 .46 .47 .48 .48 .48 .51 .54.54 .55 .58 .62 .66 .66 .67 .68 .75 Construct a stem-and-leaf display using repeatedstems, and comment on any interesting features of thedisplay.Following is the data related to the daily production of the two factories of same product located in two different states. Factory Daily Production Factory 1 66 66 73 83 74 73 73 69 82 71 73 66 67 80 79 78 Factory 2 66 63 71 65 65 67 57 48 71 73 68 58 62 81 60 62 72 72 57 77 68 Calculate the critical values “ttab”, and tcal