An airline is trying two new boarding procedures, Option 1 and Option 2, to load passengers onto their Long Beach (LGB) to San Francisco (SFO) flights. Since Option 1 has more automation, the airline suspects that the mean Option 1 loading time is less than the mean Option 2 loading time. To see if this is true, the airline selects a random sample of 265 flights from LGB to SFO using Option 1 and records their loading times. The sample mean is found to be 17.6 minutes, vith a sample standard deviation of 4.7 minutes. They also select an independent random sample of 280 flights from LGB to SFO using Option 2 and record their oading times. The sample mean is found to be 18.4 minutes, with a sample standard deviation of 3.6 minutes. Since the sample sizes are quite large, it is assumed that the population standard deviation of the loading times using Option 1 and the loading times using Option 2 can be estimated to be the sample standard deviation values given above. At the 0.05 level of significance, is there sufficient evidence to support the claim that the mean Option 1 loading time, µ, is less than the mean Option 2 loading time, µ,, for the airline's flights from LGB to SFO? Perform a one-tailed test. Then complete the parts below. Carry your intermediate computations to at least three decimal places. (If necessary, consult a list of formulas.) (a) State the null hypothesis H, and the alternative hypothesis H,. p H. :0 H, :0 (b) Determine the type of test statistic to use. (Choose one) ▼ D=0 OSO Dlo
An airline is trying two new boarding procedures, Option 1 and Option 2, to load passengers onto their Long Beach (LGB) to San Francisco (SFO) flights. Since Option 1 has more automation, the airline suspects that the mean Option 1 loading time is less than the mean Option 2 loading time. To see if this is true, the airline selects a random sample of 265 flights from LGB to SFO using Option 1 and records their loading times. The sample mean is found to be 17.6 minutes, vith a sample standard deviation of 4.7 minutes. They also select an independent random sample of 280 flights from LGB to SFO using Option 2 and record their oading times. The sample mean is found to be 18.4 minutes, with a sample standard deviation of 3.6 minutes. Since the sample sizes are quite large, it is assumed that the population standard deviation of the loading times using Option 1 and the loading times using Option 2 can be estimated to be the sample standard deviation values given above. At the 0.05 level of significance, is there sufficient evidence to support the claim that the mean Option 1 loading time, µ, is less than the mean Option 2 loading time, µ,, for the airline's flights from LGB to SFO? Perform a one-tailed test. Then complete the parts below. Carry your intermediate computations to at least three decimal places. (If necessary, consult a list of formulas.) (a) State the null hypothesis H, and the alternative hypothesis H,. p H. :0 H, :0 (b) Determine the type of test statistic to use. (Choose one) ▼ D=0 OSO Dlo

Holt Mcdougal Larson Pre-algebra: Student Edition 2012
1st Edition
ISBN:9780547587776
Author:HOLT MCDOUGAL
Publisher:HOLT MCDOUGAL
Chapter11: Data Analysis And Probability
Section: Chapter Questions
Problem 8CR

Related questions
Question
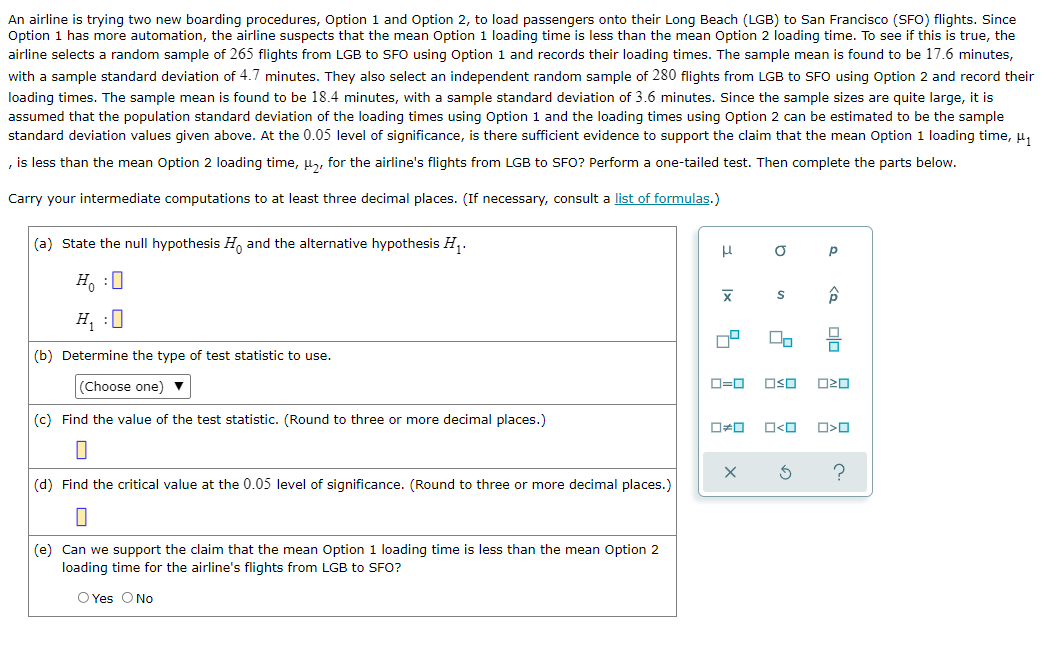
Transcribed Image Text:An airline is trying two new boarding procedures, Option 1 and Option 2, to load passengers onto their Long Beach (LGB) to San Francisco (SFO) flights. Since
Option 1 has more automation, the airline suspects that the mean Option 1 loading time is less than the mean Option 2 loading time. To see if this is true, the
airline selects a random sample of 265 flights from LGB to SFO using Option 1 and records their loading times. The sample mean is found to be 17.6 minutes,
with a sample standard deviation of 4.7 minutes. They also select an independent random sample of 280 flights from LGB to SFO using Option 2 and record their
loading times. The sample mean is found to be 18.4 minutes, with a sample standard deviation of 3.6 minutes. Since the sample sizes are quite large, it is
assumed that the population standard deviation of the loading times using Option 1 and the loading times using Option 2 can be estimated to be the sample
standard deviation values given above. At the 0.05 level of significance, is there sufficient evidence to support the claim that the mean Option 1 loading time, u,
, is less than the mean Option 2 loading time, µ, for the airline's flights from LGB to SFO? Perform a one-tailed test. Then complete the parts below.
Carry your intermediate computations to at least three decimal places. (If necessary, consult a list of formulas.)
(a) State the null hypothesis H, and the alternative hypothesis H,.
Ho :0
H, :0
(b) Determine the type of test statistic to use.
(Choose one) ▼
D=0
O20
(c) Find the value of the test statistic. (Round to three or more decimal places.)
O<O
(d) Find the critical value at the 0.05 level of significance. (Round to three or more decimal places.)
(e) Can we support the claim that the mean Option 1 loading time is less than the mean Option 2
loading time for the airline's flights from LGB to SFO?
O Yes ONo
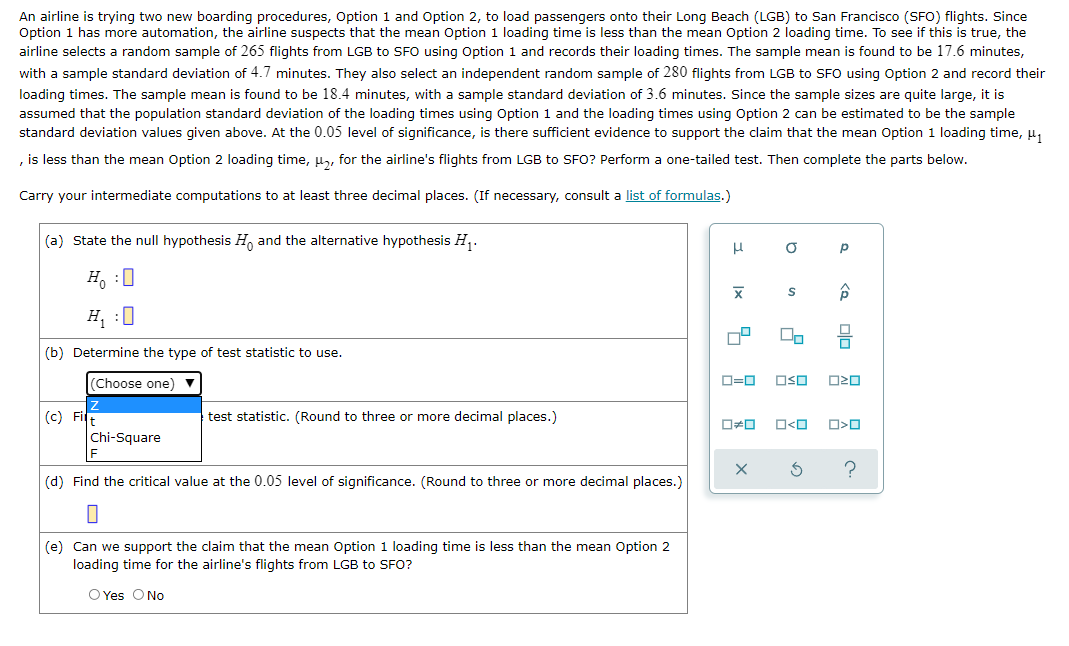
Transcribed Image Text:An airline is trying two new boarding procedures, Option 1 and Option 2, to load passengers onto their Long Beach (LGB) to San Francisco (SFO) flights. Since
Option
has more automation, the airline suspects that the mean Option 1 loading time is less than the mean Option 2 loading time. To see if this is true, the
airline selects a random sample of 265 flights from LGB to SFO using Option 1 and records their loading times. The sample mean is found to be 17.6 minutes,
with a sample standard deviation of 4.7 minutes. They also select an independent random sample of 280 flights from LGB to SFO using Option 2 and record their
loading times. The sample mean is found to be 18.4 minutes, with a sample standard deviation of 3.6 minutes. Since the sample sizes are quite large, it is
assumed that the population standard deviation of the loading times using Option 1 and the loading times using Option 2 can be estimated to be the sample
standard deviation values given above. At the 0.05 level of significance, is there sufficient evidence to support the claim that the mean Option 1 loading time, µ,
, is less than the mean Option 2 loading time, u, for the airline's flights from LGB to SFO? Perform a one-tailed test. Then complete the parts below.
Carry your intermediate computations to at least three decimal places. (If necessary, consult a list of formulas.)
(a) State the null hypothesis H, and the alternative hypothesis H,.
p
H, :0
H, :0
(b) Determine the type of test statistic to use.
(Choose one)
D=0
OSO
(c) Fir
test statistic. (Round to three or more decimal places.)
O<O
Chi-Square
(d) Find the critical value at the 0.05 level of significance. (Round to three or more decimal places.)
(e) Can we support the claim that the mean Option 1 loading time is less than the mean Option 2
loading time for the airline's flights from LGB to SFO?
O Yes O No
Expert Solution
This question has been solved!
Explore an expertly crafted, step-by-step solution for a thorough understanding of key concepts.

This is a popular solution!

Trending now
This is a popular solution!

Step by step
Solved in 2 steps

Recommended textbooks for you
Holt Mcdougal Larson Pre-algebra: Student Edition…
Algebra
ISBN:
9780547587776
Author:
HOLT MCDOUGAL
Publisher:
HOLT MCDOUGAL

Glencoe Algebra 1, Student Edition, 9780079039897…
Algebra
ISBN:
9780079039897
Author:
Carter
Publisher:
McGraw Hill

College Algebra (MindTap Course List)
Algebra
ISBN:
9781305652231
Author:
R. David Gustafson, Jeff Hughes
Publisher:
Cengage Learning
Holt Mcdougal Larson Pre-algebra: Student Edition…
Algebra
ISBN:
9780547587776
Author:
HOLT MCDOUGAL
Publisher:
HOLT MCDOUGAL
Glencoe Algebra 1, Student Edition, 9780079039897…
Algebra
ISBN:
9780079039897
Author:
Carter
Publisher:
McGraw Hill
College Algebra (MindTap Course List)
Algebra
ISBN:
9781305652231
Author:
R. David Gustafson, Jeff Hughes
Publisher:
Cengage Learning
