AA 4-3 Extended Analysis LO A1, P4 Key comparative figures for Samsung, Apple, and Google follow. In millions Samsung Apple Google Net sales Cost of Sales $ 126,336 $ 197,691 $ 260,174 $ 161,782 $ 161,857 $ 71,896 tes Required: 1. Compute the gross margin ratio for each of the three companies. (millions of $) 2-a. Is Samsung's gross margin ratio better or worse than that for Apple? 2-b. Is Samsung's gross margin ratio better or worse than that for Google? 3-a. Is the single-step or multiple-step income statement format used in the case of Apple? 3-b. Is the single-step or multiple-step income statement format used in the case of Google? 3-c. Is the single-step or multiple-step income statement format used in the case of Samsung? Complete this question by entering your answers in the tabs below. Req 1 Req 2A and 2B Req 3A to 3C Compute the gross margin ratio for each of the three companies. (millions of $) Note: Round your percentage answers to 1 decimal place. Enter your answers in millions of dollars or Korean won. In millions Samsung Apple Google Net sales $ 197,691 $ 260,174 $ 161,857 Cost of sales 126,336 161,782 71,896 Gross margin Gross margin ratio % % %
AA 4-3 Extended Analysis LO A1, P4 Key comparative figures for Samsung, Apple, and Google follow. In millions Samsung Apple Google Net sales Cost of Sales $ 126,336 $ 197,691 $ 260,174 $ 161,782 $ 161,857 $ 71,896 tes Required: 1. Compute the gross margin ratio for each of the three companies. (millions of $) 2-a. Is Samsung's gross margin ratio better or worse than that for Apple? 2-b. Is Samsung's gross margin ratio better or worse than that for Google? 3-a. Is the single-step or multiple-step income statement format used in the case of Apple? 3-b. Is the single-step or multiple-step income statement format used in the case of Google? 3-c. Is the single-step or multiple-step income statement format used in the case of Samsung? Complete this question by entering your answers in the tabs below. Req 1 Req 2A and 2B Req 3A to 3C Compute the gross margin ratio for each of the three companies. (millions of $) Note: Round your percentage answers to 1 decimal place. Enter your answers in millions of dollars or Korean won. In millions Samsung Apple Google Net sales $ 197,691 $ 260,174 $ 161,857 Cost of sales 126,336 161,782 71,896 Gross margin Gross margin ratio % % %

Accounting (Text Only)
26th Edition
ISBN:9781285743615
Author:Carl Warren, James M. Reeve, Jonathan Duchac
Publisher:Carl Warren, James M. Reeve, Jonathan Duchac
Chapter3: The Adjusting Process
Section: Chapter Questions
Problem 3.29EX

Related questions
Question
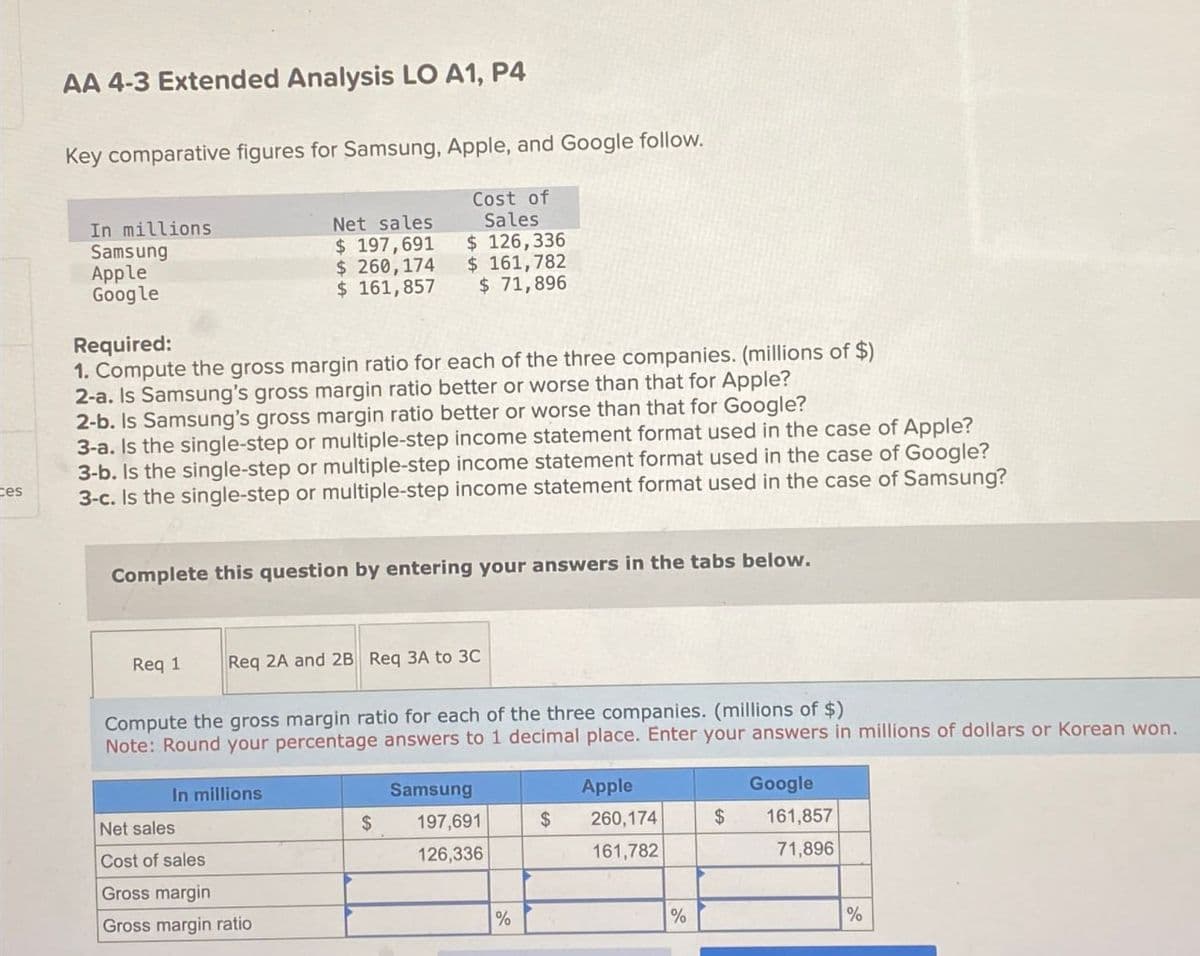
Transcribed Image Text:AA 4-3 Extended Analysis LO A1, P4
Key comparative figures for Samsung, Apple, and Google follow.
In millions
Samsung
Apple
Google
Net sales
Cost of
Sales
$ 126,336
$ 197,691
$ 260,174
$ 161,782
$ 161,857
$ 71,896
tes
Required:
1. Compute the gross margin ratio for each of the three companies. (millions of $)
2-a. Is Samsung's gross margin ratio better or worse than that for Apple?
2-b. Is Samsung's gross margin ratio better or worse than that for Google?
3-a. Is the single-step or multiple-step income statement format used in the case of Apple?
3-b. Is the single-step or multiple-step income statement format used in the case of Google?
3-c. Is the single-step or multiple-step income statement format used in the case of Samsung?
Complete this question by entering your answers in the tabs below.
Req 1
Req 2A and 2B Req 3A to 3C
Compute the gross margin ratio for each of the three companies. (millions of $)
Note: Round your percentage answers to 1 decimal place. Enter your answers in millions of dollars or Korean won.
In millions
Samsung
Apple
Google
Net sales
$
197,691
$
260,174
$
161,857
Cost of sales
126,336
161,782
71,896
Gross margin
Gross margin ratio
%
%
%
Expert Solution
This question has been solved!
Explore an expertly crafted, step-by-step solution for a thorough understanding of key concepts.

This is a popular solution!

Trending now
This is a popular solution!

Step by step
Solved in 2 steps

Recommended textbooks for you
Accounting (Text Only)
Accounting
ISBN:
9781285743615
Author:
Carl Warren, James M. Reeve, Jonathan Duchac
Publisher:
Cengage Learning

Corporate Financial Accounting
Accounting
ISBN:
9781305653535
Author:
Carl Warren, James M. Reeve, Jonathan Duchac
Publisher:
Cengage Learning

Corporate Financial Accounting
Accounting
ISBN:
9781337398169
Author:
Carl Warren, Jeff Jones
Publisher:
Cengage Learning
Accounting (Text Only)
Accounting
ISBN:
9781285743615
Author:
Carl Warren, James M. Reeve, Jonathan Duchac
Publisher:
Cengage Learning
Corporate Financial Accounting
Accounting
ISBN:
9781305653535
Author:
Carl Warren, James M. Reeve, Jonathan Duchac
Publisher:
Cengage Learning
Corporate Financial Accounting
Accounting
ISBN:
9781337398169
Author:
Carl Warren, Jeff Jones
Publisher:
Cengage Learning

Cornerstones of Financial Accounting
Accounting
ISBN:
9781337690881
Author:
Jay Rich, Jeff Jones
Publisher:
Cengage Learning

Financial & Managerial Accounting
Accounting
ISBN:
9781337119207
Author:
Carl Warren, James M. Reeve, Jonathan Duchac
Publisher:
Cengage Learning