able below shows the advertising expenditure per month and the number of units of houses sold by a well-known real estate company for nine consecutive months. Advertising expenditure per month, ($'000) 23 24 20 21 30 19 27 31 32 Number of houses sold 50 62 43 40 74 34 63 70 68 Find the coefficient of determination between the two variables. Select one:
able below shows the advertising expenditure per month and the number of units of houses sold by a well-known real estate company for nine consecutive months. Advertising expenditure per month, ($'000) 23 24 20 21 30 19 27 31 32 Number of houses sold 50 62 43 40 74 34 63 70 68 Find the coefficient of determination between the two variables. Select one:

Glencoe Algebra 1, Student Edition, 9780079039897, 0079039898, 2018
18th Edition
ISBN:9780079039897
Author:Carter
Publisher:Carter
Chapter4: Equations Of Linear Functions
Section4.5: Correlation And Causation
Problem 2AGP

Related questions
Question
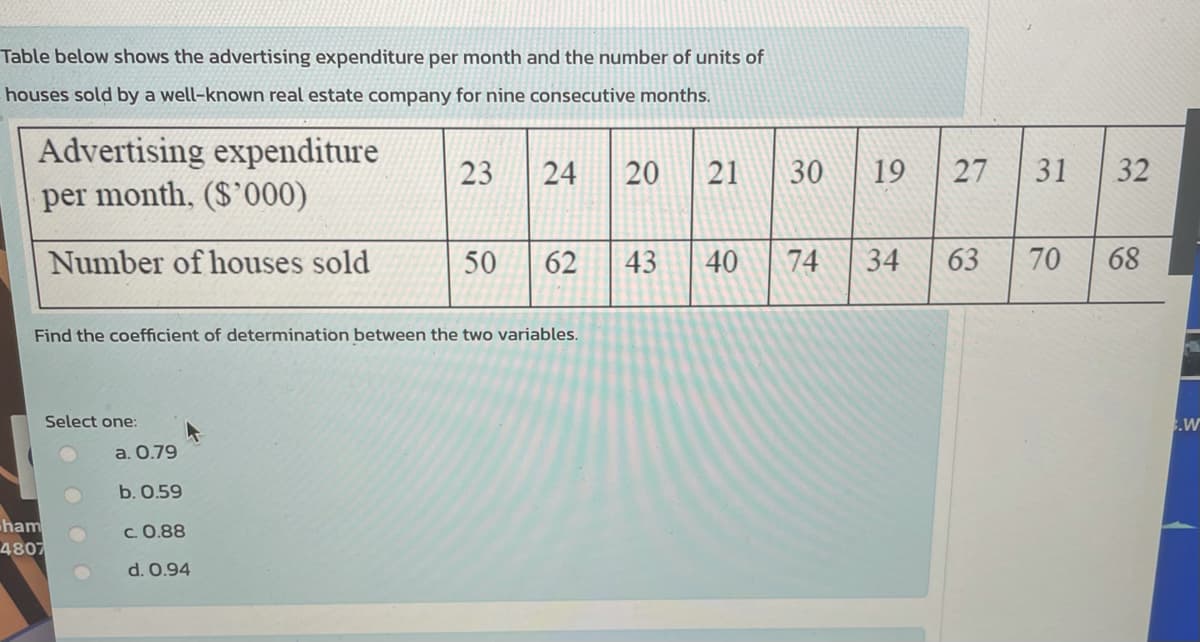
Transcribed Image Text:Table below shows the advertising expenditure per month and the number of units of
houses sold by a well-known real estate company for nine consecutive months.
Advertising expenditure
23
20
|21
30
19
27
31
32
per month, ($'000)
Number of houses sold
50
62
43
40
74
63
70
68
Find the coefficient of determination between the two variables.
Select one:
a. О.79
b. О.59
ham
4807
c. 0.88
d. 0.94
34
24
Expert Solution
This question has been solved!
Explore an expertly crafted, step-by-step solution for a thorough understanding of key concepts.

Step by step
Solved in 2 steps

Recommended textbooks for you
Glencoe Algebra 1, Student Edition, 9780079039897…
Algebra
ISBN:
9780079039897
Author:
Carter
Publisher:
McGraw Hill
Glencoe Algebra 1, Student Edition, 9780079039897…
Algebra
ISBN:
9780079039897
Author:
Carter
Publisher:
McGraw Hill