Accordi the historical data, the life expectancy in Mexico is equal to the life expectancy in Spain. A new study has been made to see whether this has changea. Records of 205 individuals from Mexico who died recently are selected at random. The 205 individuals lived an average of 71.8 years with a standard deviation of 2.6 years. Records of 250 individuals from Spain who died recently are selected at random and independently. The 250 individuals lived an average of 71.2 years with a standard deviation of 3.0 years. Assume that the population standard deviation of the life expectancy can be estimated by the sample standard deviations, since the samples that are used to compute them are quite large. At the 0.05 level of significance, is there enough evidence to support th claim that the life expectancy, H1, in Mexico is not equal to the life expectancy, µ,, in Spain anymore? Perform a two-tailed test. Then complete the parts belov Carry your intermediate computations to at least three decimal places. (If necessary, consult a list of formulas.) (a) State the null hypothesis H, and the alternative hypothesis H,. p H, :0 H, :0 (b) Determine the type of test statistic to use. (Choose one) ▼ O=0 OSO (c) Find the value of the test statistic. (Round to three or more decimal places.) O
Accordi the historical data, the life expectancy in Mexico is equal to the life expectancy in Spain. A new study has been made to see whether this has changea. Records of 205 individuals from Mexico who died recently are selected at random. The 205 individuals lived an average of 71.8 years with a standard deviation of 2.6 years. Records of 250 individuals from Spain who died recently are selected at random and independently. The 250 individuals lived an average of 71.2 years with a standard deviation of 3.0 years. Assume that the population standard deviation of the life expectancy can be estimated by the sample standard deviations, since the samples that are used to compute them are quite large. At the 0.05 level of significance, is there enough evidence to support th claim that the life expectancy, H1, in Mexico is not equal to the life expectancy, µ,, in Spain anymore? Perform a two-tailed test. Then complete the parts belov Carry your intermediate computations to at least three decimal places. (If necessary, consult a list of formulas.) (a) State the null hypothesis H, and the alternative hypothesis H,. p H, :0 H, :0 (b) Determine the type of test statistic to use. (Choose one) ▼ O=0 OSO (c) Find the value of the test statistic. (Round to three or more decimal places.) O

Glencoe Algebra 1, Student Edition, 9780079039897, 0079039898, 2018
18th Edition
ISBN:9780079039897
Author:Carter
Publisher:Carter
Chapter10: Statistics
Section10.6: Summarizing Categorical Data
Problem 10CYU

Related questions
Question
Transcribed Image Text:Accordi
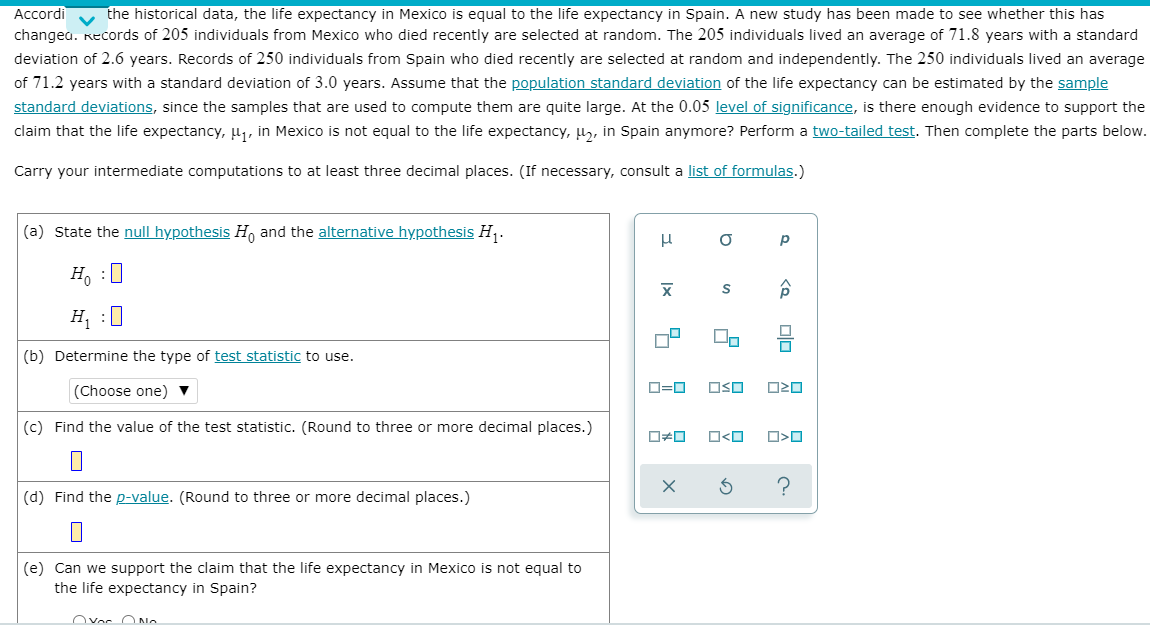
the historical data, the life expectancy in Mexico is equal to the life expectancy in Spain. A new study has been made to see whether this has
changea. Records of 205 individuals from Mexico who died recently are selected at random. The 205 individuals lived an average of 71.8 years with a standard
deviation of 2.6 years. Records of 250 individuals from Spain who died recently are selected at random and independently. The 250 individuals lived an average
of 71.2 years with a standard deviation of 3.0 years. Assume that the population standard deviation of the life expectancy can be estimated by the sample
standard deviations, since the samples that are used to compute them are quite large. At the 0.05 level of significance, is there enough evidence to support the
claim that the life expectancy, H1, in Mexico is not equal to the life expectancy, µ,, in Spain anymore? Perform a two-tailed test. Then complete the parts below.
Carry your intermediate computations to at least three decimal places. (If necessary, consult a list of formulas.)
(a) State the null hypothesis H, and the alternative hypothesis H,.
p
H, :0
H, :0
(b) Determine the type of test statistic to use.
(Choose one) ▼
O=0
OSO
(c) Find the value of the test statistic. (Round to three or more decimal places.)
O<O
?
(d) Find the p-value. (Round to three or more decimal places.)
(e) Can we support the claim that the life expectancy in Mexico is not equal to
the life expectancy in Spain?
Ovor O N.
Expert Solution
This question has been solved!
Explore an expertly crafted, step-by-step solution for a thorough understanding of key concepts.

Step by step
Solved in 2 steps

Knowledge Booster


Learn more about
Need a deep-dive on the concept behind this application? Look no further. Learn more about this topic, statistics and related others by exploring similar questions and additional content below.Recommended textbooks for you
Glencoe Algebra 1, Student Edition, 9780079039897…
Algebra
ISBN:
9780079039897
Author:
Carter
Publisher:
McGraw Hill

Holt Mcdougal Larson Pre-algebra: Student Edition…
Algebra
ISBN:
9780547587776
Author:
HOLT MCDOUGAL
Publisher:
HOLT MCDOUGAL

Algebra & Trigonometry with Analytic Geometry
Algebra
ISBN:
9781133382119
Author:
Swokowski
Publisher:
Cengage
Glencoe Algebra 1, Student Edition, 9780079039897…
Algebra
ISBN:
9780079039897
Author:
Carter
Publisher:
McGraw Hill
Holt Mcdougal Larson Pre-algebra: Student Edition…
Algebra
ISBN:
9780547587776
Author:
HOLT MCDOUGAL
Publisher:
HOLT MCDOUGAL
Algebra & Trigonometry with Analytic Geometry
Algebra
ISBN:
9781133382119
Author:
Swokowski
Publisher:
Cengage

College Algebra
Algebra
ISBN:
9781305115545
Author:
James Stewart, Lothar Redlin, Saleem Watson
Publisher:
Cengage Learning

College Algebra (MindTap Course List)
Algebra
ISBN:
9781305652231
Author:
R. David Gustafson, Jeff Hughes
Publisher:
Cengage Learning
