According to a health publication, 15.9% of persons under the age of 65 have no health insurance coverage. Suppose that four persons under the age of 65 are randomly selected. a. Determine the probability distribution for the number, X, who have no health insurance coverage. b. Determine and interpret the mean of X a. Complete the table below to determine the probability distribution of X. In this problem, you are calculating the probability value for each possible value of X. You will first calculate the probability that X equals 0. This calcualted probability will then go in the column next to 0. Then you will calculate the probability that X equals 1. This calculated probability will go in the column next to and so on. 2 3 4 (Round to four decimal places as needed.) b. The mean of X is Choose the correct interpretation of the mean below. O A. On average, we would expect this many people out of one under the age of 65 to have no health insurance coverage. 0 B. On average, we would expect this many people out of four under the age of 65 to have health insurance coverage ° C. On average, we would expect this many people out of four under the age of 65 to have no health insurance coverage
According to a health publication, 15.9% of persons under the age of 65 have no health insurance coverage. Suppose that four persons under the age of 65 are randomly selected. a. Determine the probability distribution for the number, X, who have no health insurance coverage. b. Determine and interpret the mean of X a. Complete the table below to determine the probability distribution of X. In this problem, you are calculating the probability value for each possible value of X. You will first calculate the probability that X equals 0. This calcualted probability will then go in the column next to 0. Then you will calculate the probability that X equals 1. This calculated probability will go in the column next to and so on. 2 3 4 (Round to four decimal places as needed.) b. The mean of X is Choose the correct interpretation of the mean below. O A. On average, we would expect this many people out of one under the age of 65 to have no health insurance coverage. 0 B. On average, we would expect this many people out of four under the age of 65 to have health insurance coverage ° C. On average, we would expect this many people out of four under the age of 65 to have no health insurance coverage

Chapter8: Sequences, Series,and Probability
Section8.7: Probability
Problem 4ECP: Show that the probability of drawing a club at random from a standard deck of 52 playing cards is...

Related questions

Question
100%
15.9% of persons under the age of 65 have no health insurance coverage. Suppose that 4 persons are selected.
A) Determine
B) Determine and interpret the
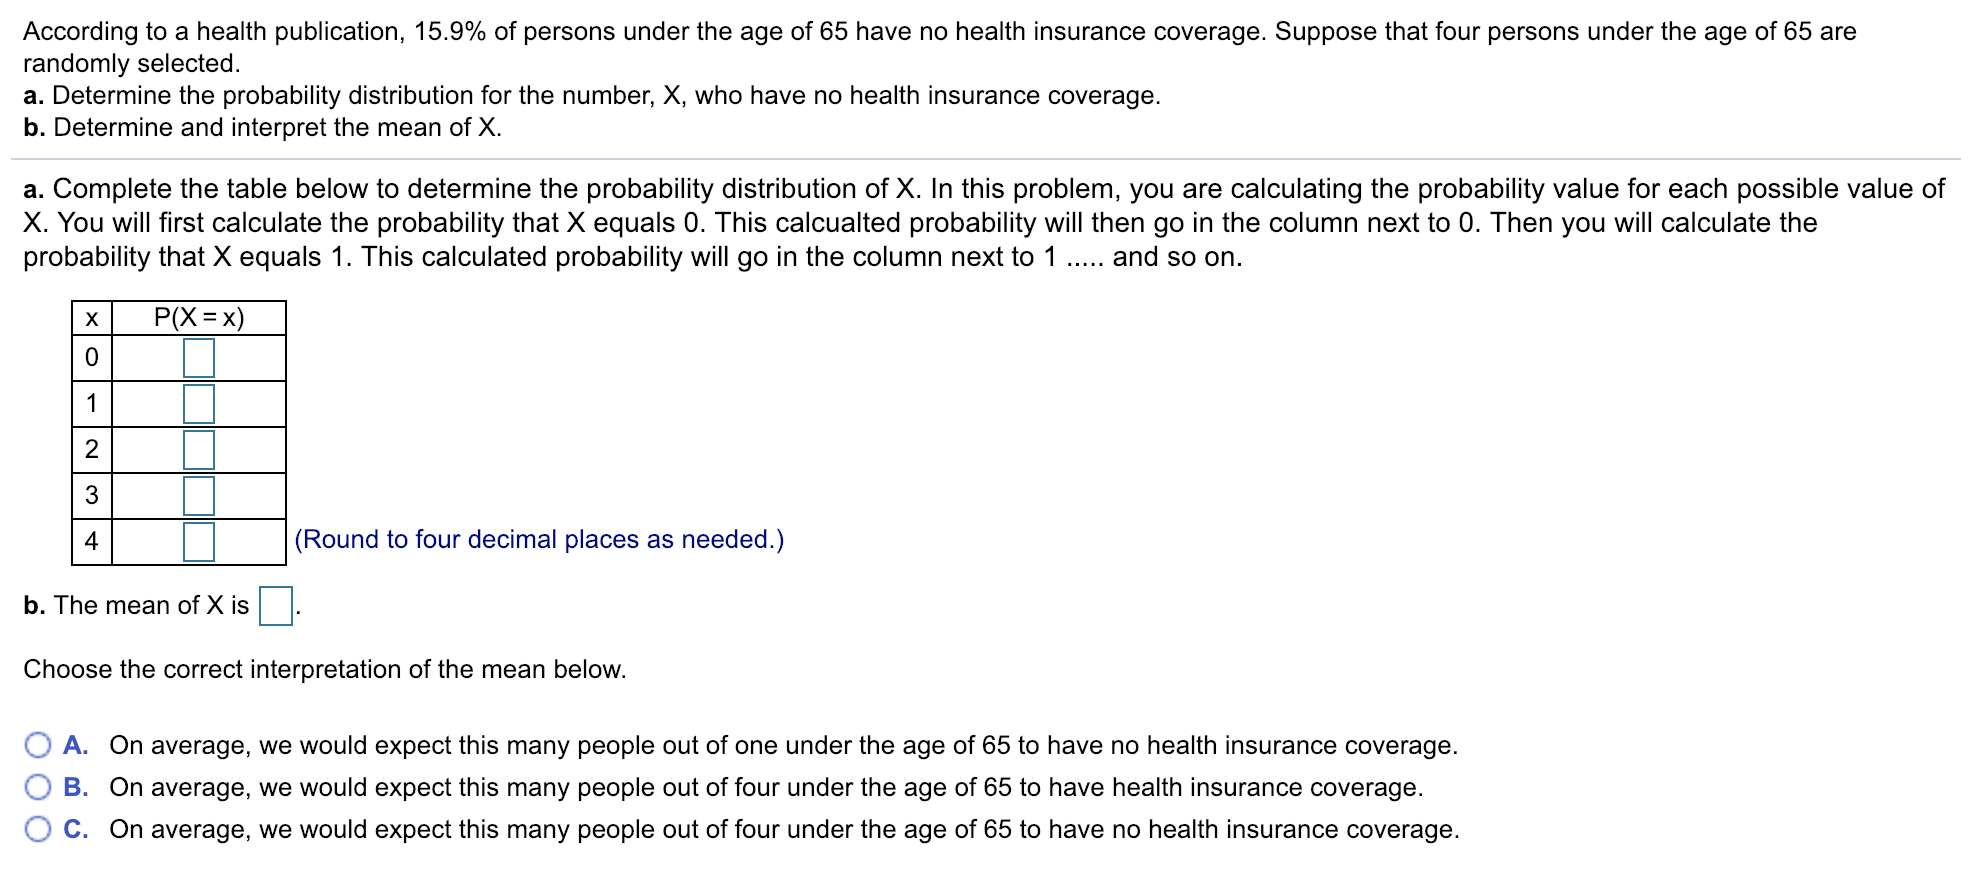
Transcribed Image Text:According to a health publication, 15.9% of persons under the age of 65 have no health insurance coverage. Suppose that four persons under the age of 65 are
randomly selected.
a. Determine the probability distribution for the number, X, who have no health insurance coverage.
b. Determine and interpret the mean of X
a. Complete the table below to determine the probability distribution of X. In this problem, you are calculating the probability value for each possible value of
X. You will first calculate the probability that X equals 0. This calcualted probability will then go in the column next to 0. Then you will calculate the
probability that X equals 1. This calculated probability will go in the column next to and so on.
2
3
4
(Round to four decimal places as needed.)
b. The mean of X is
Choose the correct interpretation of the mean below.
O A. On average, we would expect this many people out of one under the age of 65 to have no health insurance coverage.
0 B. On average, we would expect this many people out of four under the age of 65 to have health insurance coverage
° C. On average, we would expect this many people out of four under the age of 65 to have no health insurance coverage
Expert Solution
This question has been solved!
Explore an expertly crafted, step-by-step solution for a thorough understanding of key concepts.

This is a popular solution!

Trending now
This is a popular solution!

Step by step
Solved in 6 steps with 4 images

Knowledge Booster


Learn more about
Need a deep-dive on the concept behind this application? Look no further. Learn more about this topic, statistics and related others by exploring similar questions and additional content below.Recommended textbooks for you

Holt Mcdougal Larson Pre-algebra: Student Edition…
Algebra
ISBN:
9780547587776
Author:
HOLT MCDOUGAL
Publisher:
HOLT MCDOUGAL

College Algebra (MindTap Course List)
Algebra
ISBN:
9781305652231
Author:
R. David Gustafson, Jeff Hughes
Publisher:
Cengage Learning
Holt Mcdougal Larson Pre-algebra: Student Edition…
Algebra
ISBN:
9780547587776
Author:
HOLT MCDOUGAL
Publisher:
HOLT MCDOUGAL
College Algebra (MindTap Course List)
Algebra
ISBN:
9781305652231
Author:
R. David Gustafson, Jeff Hughes
Publisher:
Cengage Learning