According to a recent study, college students own a mean of 6.75 technological devices. (laptops, smartphones, etc.). Karen conducts a SRS of 60 college students and finds that her sample has a mean of x = 5.5 technological devices. Conduct a hypothesis test at the technological devices owned by college students is less than 6.75. Assume that o = 5.8 devices. = 0.05 level to determine if you can conclude that the mean number of Note: Here are some symbols you may wish to copy when writing the null and alternate hypotheses: Но: O = H1: n = Ox = Work for ox : nearest thousandth Z = Work for z: nearest hundredth
According to a recent study, college students own a mean of 6.75 technological devices. (laptops, smartphones, etc.). Karen conducts a SRS of 60 college students and finds that her sample has a mean of x = 5.5 technological devices. Conduct a hypothesis test at the technological devices owned by college students is less than 6.75. Assume that o = 5.8 devices. = 0.05 level to determine if you can conclude that the mean number of Note: Here are some symbols you may wish to copy when writing the null and alternate hypotheses: Но: O = H1: n = Ox = Work for ox : nearest thousandth Z = Work for z: nearest hundredth

Glencoe Algebra 1, Student Edition, 9780079039897, 0079039898, 2018
18th Edition
ISBN:9780079039897
Author:Carter
Publisher:Carter
Chapter10: Statistics
Section10.5: Comparing Sets Of Data
Problem 3BGP

Related questions
Question
This is a long question and both pictures are part of the same question though.
Transcribed Image Text:UESTION 14
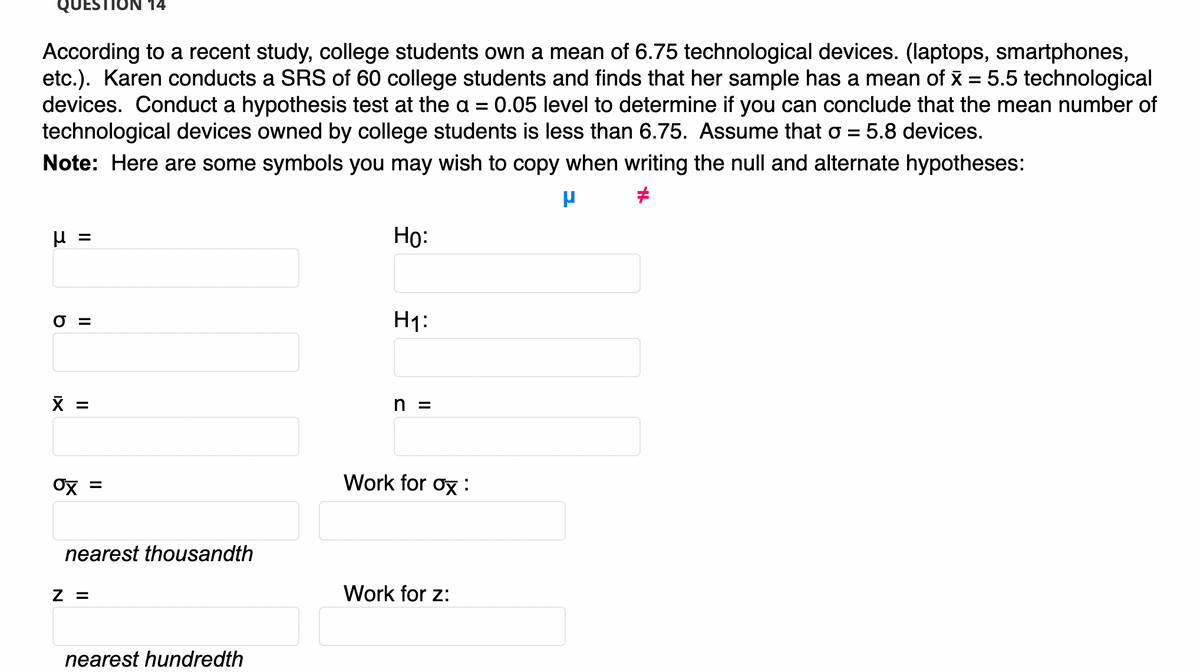
According to a recent study, college students own a mean of 6.75 technological devices. (laptops, smartphones,
etc.). Karen conducts a SRS of 60 college students and finds that her sample has a mean of x = 5.5 technological
devices. Conduct a hypothesis test at the a = 0.05 level to determine if you can conclude that the mean number of
technological devices owned by college students is less than 6.75. Assume that o = 5.8 devices.
%3D
Note: Here are some symbols you may wish to copy when writing the null and alternate hypotheses:
Но:
%3D
O =
H1:
X =
n =
Ox =
Work for ox :
nearest thousandth
Z =
Work for z:
nearest hundredth
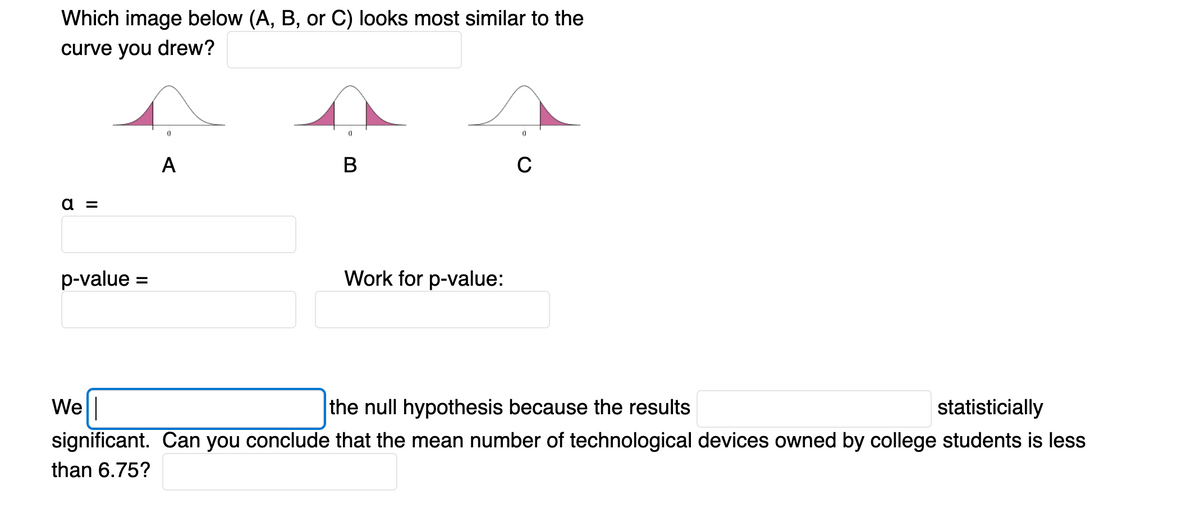
Transcribed Image Text:Which image below (A, B, or C) looks most similar to the
curve you drew?
A
В
C
а 3
p-value =
Work for p-value:
We|
significant. Can you conclude that the mean number of technological devices owned by college students is less
the null hypothesis because the results
statisticially
than 6.75?
Expert Solution
This question has been solved!
Explore an expertly crafted, step-by-step solution for a thorough understanding of key concepts.

Step by step
Solved in 3 steps with 2 images

Recommended textbooks for you
Glencoe Algebra 1, Student Edition, 9780079039897…
Algebra
ISBN:
9780079039897
Author:
Carter
Publisher:
McGraw Hill
Glencoe Algebra 1, Student Edition, 9780079039897…
Algebra
ISBN:
9780079039897
Author:
Carter
Publisher:
McGraw Hill